Through a Gender Lens

Housing and Homelessness

Housing costs are a major expense for many families and impact the financial stability of households [1]; homeownership can be an important economic tool for families [2][3]; and some Forsyth County residents who have challenges maintaining stable housing may experience homelessness.
Data describing the number of individuals who are incarcerated within Forsyth County are included on this page as well because incarcerated people are residents of Forsyth County during the duration of their incarceration here and this data describes where these residents are currently living.

Key Findings

Females are more likely to experience burdensome housing costs than males, and Black females have higher rates of housing cost-burden than White and Latina females.
Homeownership rates are higher for residents in married-couple households and White residents than residents in other types of households and Black and Latinx residents.
Black residents disproportionately experienced homelessness on a single night in January from 2018-2020.
During 2016, a daily average of 76 females were incarcerated in Forsyth County jails, and 84 were incarcerated in Forsyth County prisons.

Housing and Homeownership

Housing costs can represent a major household expense. Households that spend more than 30% of their income on housing are often defined as being cost-burdened, and experiencing housing cost burden can negatively impact the financial stability of a household [1]. Homeownership is important to one’s economic well-being because homeowners have the ability to tap into additional financial resources that come with having a home, such as a home equity or reverse mortgage. Additionally, owning a home is one way for families to accumulate wealth although there are significant differences in that accumulation especially by race and ethnicity [2][3]. Compared to White residents, Black and Latinx residents have lower rates of homeownership, are more likely to buy their first home at a later age, have less equity in their homes, and are less likely to own their home without any financing [4]. These disparities affect the economic returns for owning a home, including the ability to accumulate wealth. Thus, homeownership is an important contributor to the wealth inequality between White residents and Black and Latinx residents.  

This section looks at Forsyth County’s Fair Market Rent, a measure established by the U.S. Department of Housing and Urban Development, and the income that would be required to pay that rent without being housing-cost burdened. This section also provides the percentage of Forsyth County residents experiencing housing cost burden, the percentage of residents living in housing that their household owns, and the number of people incarcerated in Forsyth County.

Glossary terms used in this section: Median, Cost-Burdened

Key Points

From 2014-2018, 46% of adult females lived in cost-burdened renting households compared to 37% of adult males.

Black adult females were significantly more likely to be living in renting households that were cost burdened than Latina and White adult females.
A higher percentage of residents living in married-couple households live in an owned home compared to any other household composition, but that has decreased over time.

The percentage of females living alone has also decreased over time.
The income needed for a 1-bedroom apartment in 2020 was higher than the most recent data on median incomes for full-time Latinx workers, and the income needed for a 2-bedroom apartment is higher than the median income for full-time Black workers.
From 2014-2018, an estimated 86% of White residents living in married-couple households owned their homes, compared to 62% of Black residents and 54% of Latinx residents living in married-couple households.

Homeownership rates are also consistently higher for White females who live alone and residents in households with White female householders with no spouse present compared to their Black and Latina counterparts.

Data Dashboards

Annual Income Needed to Afford Fair Market Rent, 2020

Tabular Data

Fair market rent (FMR) and annual income Needed to Afford FMR in Forsyth County*, 2020
1 Bedroom
FMR, 2020
Income Needed
2 Bedroom
$617
$24,680
3 Bedroom
1 Bedroom
$30,520
$763
$1,028
$41,120
$1,256
$50,240
*Note: The Housing and Urban Development (HUD) Fair Market Rent data represents the Winston-Salem metro area which includes the following counties: Davie, Forsyth, Stoke, and Yadkin County

Key Points:

  • Fair Market Rents (FMRs) are estimated by the U.S. Department of Housing and Urban Development (HUD) annually. FMRs are used in funding decisions about various federal housing programs that assist low-income families and households. FMRs are estimates of the gross rent, which includes the base rent and essential utilities, needed for the fiscal year. The annual income needed to afford FMR is published by the National Low-Income Housing Coalition. The chart above shows the FMR and income needed in Forsyth County for the 2020 fiscal year by various bedroom types.
  • The income needed for a 1-bedroom apartment in 2020 is higher than the 2014-2018 median income of full-time Latinx workers, and the income needed for a 2-bedroom apartment is higher than the median income of full-time Black workers. Median incomes represent the level of income that half of a group is below and half of the group is above, which means that a significant number of Black and Latinx residents may struggle with housing affordability if they live alone or if they are the sole income earner in a household with dependents.

Data Notes:

Fair market rent (FMR) and annual income Needed to Afford FMR in Forsyth County*, 2020
1 Bedroom
FMR, 2020
Income Needed
2 Bedroom
$617
$24,680
3 Bedroom
1 Bedroom
$30,520
$763
$1,028
$41,120
$1,256
$50,240
*Note: The Housing and Urban Development (HUD) Fair Market Rent data represents the Winston-Salem metro area which includes the following counties: Davie, Forsyth, Stoke, and Yadkin County
  • Fair Market Rents (FMRs) are estimated by the U.S. Department of Housing and Urban Development (HUD) annually. FMRs are used in funding decisions about various federal housing programs that assist low-income families and households. FMRs are estimates of the gross rent, which includes the base rent and essential utilities, needed for the fiscal year. The annual income needed to afford FMR is published by the National Low-Income Housing Coalition. The chart above shows the FMR and income needed in Forsyth County for the 2020 fiscal year by various bedroom types.
  • The income needed for a 1-bedroom apartment in 2020 is higher than the 2014-2018 median income of full-time Latinx workers, and the income needed for a 2-bedroom apartment is higher than the median income of full-time Black workers. Median incomes represent the level of income that half of a group is below and half of the group is above, which means that a significant number of Black and Latinx residents may struggle with housing affordability if they live alone or if they are the sole income earner in a household with dependents.

Households spending More than 30% of Income on Rent

1-year Estimates

5-year Estimates

Key Points:

  • In the 5-year data, females (compared to males) consistently lived in households that paid more than 30% of their income on rent more often. From 2014-2018, 46% of adult females lived in cost-burdened renting households compared to 37% of adult males.
  • The percentage of adult females who lived in households that were cost-burdened peaked in 2011 at 57% which was significantly higher than the percentage of females who lived in households that were cost-burdened in 2018 at 46%.
  • Among females, Black adult females were significantly more likely to have lived in renting households that were cost-burned compared to Latina and Whilte adult females from 2014-2018.
  • While it appears that more females under the age of 18 lived in cost-burdened renting households (across most 5-year periods) compared to males under the age of 18, estimates are not always significant; however, 63% of females under the age of 18 (on average) lived in households that were cost burdened from 2009-2013 which significantly decreased to an average of 55% of females from 2014-2018.
  • Racial disparities are present in the percentage of children living in cost-burdened renting households. From 2014-2018, a higher percentage of Black female children lived in cost-burdened households compared to their White and Latinx counterparts.

Data Notes:

  • Types of housing excluded from these analyses: group quarters; vacant, owned, or being bought; occupied without rent payment; no household income.
  • The margin of error for the percentage of rent-burdened adults by sex and race/ethnicity and for rent-burdened children were too high to use, and this data was excluded.
  • The margin of error for some 5-year data for children by sex and race/ethnicity is high. Analysts recommend checking the margin of error before using estimates.
  • The most cost burden data available is from 2018. Current data may change as a result of COVID-19. For more resources on how COVID-19 may be impacting this measure, click here.
  • Source: U.S. Census Bureau American Community Survey (ACS) 1- and 5-year Public Use Microdata Samples
  • In the 5-year data, females (compared to males) consistently lived in households that paid more than 30% of their income on rent more often. From 2014-2018, 46% of adult females lived in cost-burdened renting households compared to 37% of adult males.
  • The percentage of adult females who lived in households that were cost-burdened peaked in 2011 at 57% which was significantly higher than the percentage of females who lived in households that were cost-burdened in 2018 at 46%.
  • Among females, Black adult females were significantly more likely to have lived in renting households that were cost-burned compared to Latina and Whilte adult females from 2014-2018.
  • While it appears that more females under the age of 18 lived in cost-burdened renting households (across most 5-year periods) compared to males under the age of 18, estimates are not always significant; however, 63% of females under the age of 18 (on average) lived in households that were cost burdened from 2009-2013 which significantly decreased to an average of 55% of females from 2014-2018.
  • Racial disparities are present in the percentage of children living in cost-burdened renting households. From 2014-2018, a higher percentage of Black female children lived in cost-burdened households compared to their White and Latinx counterparts.
  • Types of housing excluded from these analyses: group quarters; vacant, owned, or being bought; occupied without rent payment; no household income.
  • The margin of error for the percentage of rent-burdened adults by sex and race/ethnicity and for rent-burdened children were too high to use, and this data was excluded.
  • The margin of error for some 5-year data for children by sex and race/ethnicity is high. Analysts recommend checking the margin of error before using estimates.
  • The most cost burden data available is from 2018. Current data may change as a result of COVID-19. For more resources on how COVID-19 may be impacting this measure, click here.
  • Source: U.S. Census Bureau American Community Survey (ACS) 1- and 5-year Public Use Microdata Samples

Homeownership Rates by Household Type

1-year Estimates

5-year Estimates

Key Points:

  • A higher percentage of residents living in married-couple households lived in an owned home compared to any other type of household composition in both the 1-year and 5-year data, but this has decreased over time. In 2006, 83% of married couples lived in an owned home compared to 76% of married couples in 2018.
  • The rate of homeownership for females living alone decreased from 2017-2018 from 56%-48%.
  • In the 5-year samples from 2014-2018, 86% of White residents who lived in married-couple homes owned their homes compared to 62% of Black residents and 54% of Latinx residents living in married-couple homes. The racial disparity in homeownership by household type is consistent across each 5-year data sample where married White residents have higher homeownership rates compared to their married Black and Latinx counterparts.
  • Homeownership rates were consistently higher for White females who live alone and residents in households with White female householders with no spouse present compared to their Black and Latinx counterparts.

Data Notes:

  • Those who owned their home with a mortgage or loan (includes home equity loans) or owned free and clear were classified as owned. If they rent or occupy without payment of rent, then they were classified as not owned.
  • The 1-year data samples were too small to calculate household type by race/ethnicity.
  • The margins of error for male householders with no spouse present and non-family households were too high to use in the 1-year data.
  • The margins of error for the 5-year data are particularly high for many Latinx household types and some Black household types; differences noted with other groups in the data notes are outside of the margin of error. Analysts recommend noting margins of error before using this data.
  • Source: U.S. Census Bureau American Community Survey (ACS) 1- and 5-year Public Use Microdata Samples
  • A higher percentage of residents living in married-couple households lived in an owned home compared to any other type of household composition in both the 1-year and 5-year data, but this has decreased over time. In 2006, 83% of married couples lived in an owned home compared to 76% of married couples in 2018.
  • The rate of homeownership for females living alone decreased from 2017-2018 from 56%-48%.
  • In the 5-year samples from 2014-2018, 86% of White residents who lived in married-couple homes owned their homes compared to 62% of Black residents and 54% of Latinx residents living in married-couple homes. The racial disparity in homeownership by household type is consistent across each 5-year data sample where married White residents have higher homeownership rates compared to their married Black and Latinx counterparts.
  • Homeownership rates were consistently higher for White females who live alone and residents in households with White female householders with no spouse present compared to their Black and Latinx counterparts.
  • Those who owned their home with a mortgage or loan (includes home equity loans) or owned free and clear were classified as owned. If they rent or occupy without payment of rent, then they were classified as not owned.
  • The 1-year data samples were too small to calculate household type by race/ethnicity.
  • The margins of error for male householders with no spouse present and non-family households were too high to use in the 1-year data.
  • The margins of error for the 5-year data are particularly high for many Latinx household types and some Black household types; differences noted with other groups in the data notes are outside of the margin of error. Analysts recommend noting margins of error before using this data.
  • Source: U.S. Census Bureau American Community Survey (ACS) 1- and 5-year Public Use Microdata Samples

Homelessness

The pathways to experiencing homelessness vary but unstable living arrangements are central to the risk of becoming homeless [5]. Experiencing intimate personal violence and/or economic hardship coupled with the lack of affordable housing or rental assistance can increase the risk of experiencing homelessness. Even when the economy is stable, those who experience homelessness remain on the margins of the economy and millions of low-income households are at-risk of housing instability and a number of crises that can result in homelessness. 

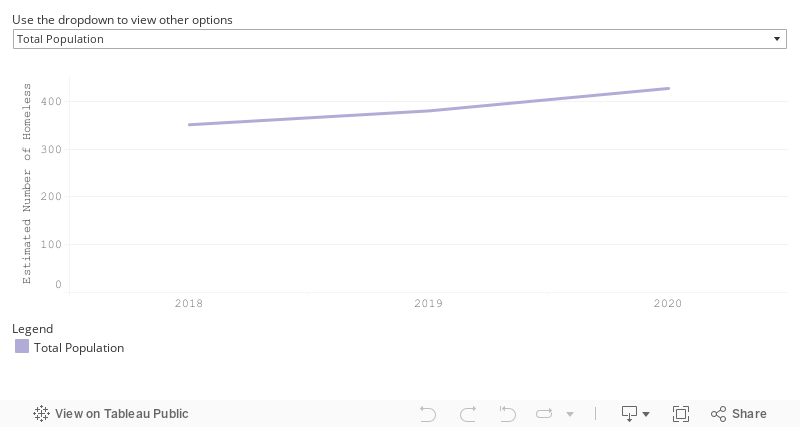
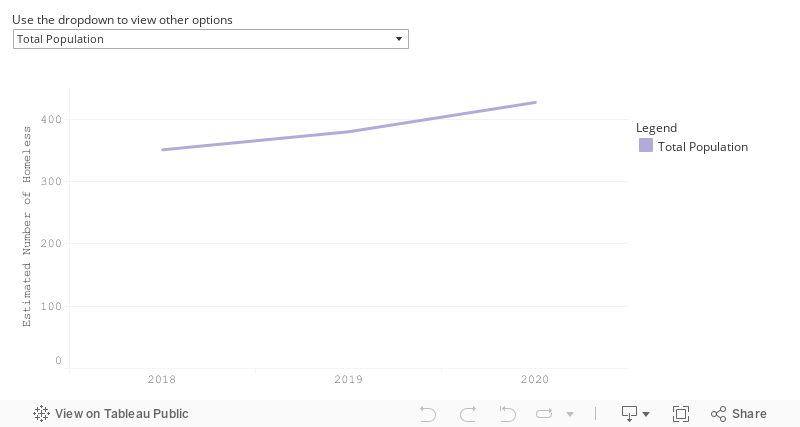
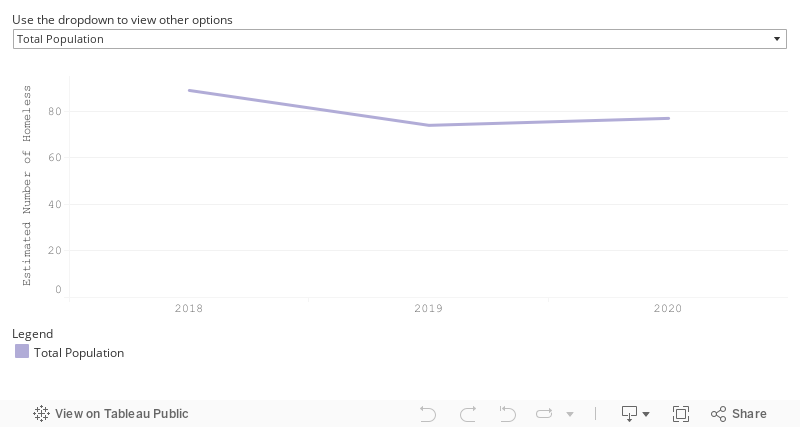
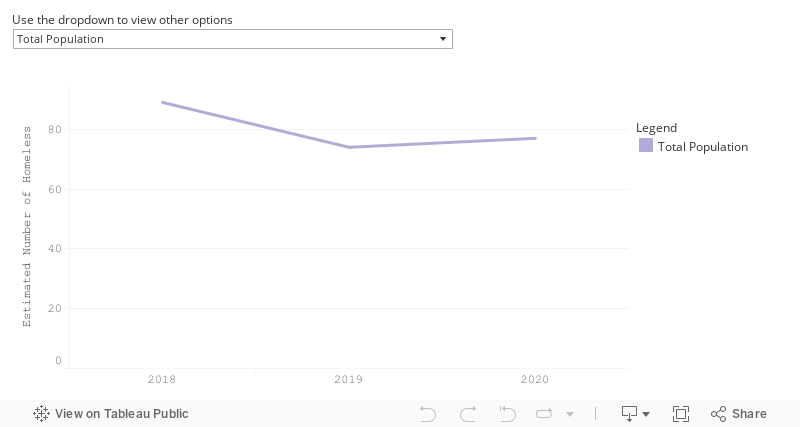
Annually, communities across the country conduct a Point-In-Time on a single night in January of people who experience homelessness in the community that is reported to the Department of Housing and Urban Development (HUD) [5]. The Point-In-Time count includes people who are unsheltered (which includes people who live on the streets, in cars, in abandoned buildings or who camp outdoors). It also includes people who are in emergency or transitional housing, but it does not include those who may be temporarily staying with family or friends. Although the Point-In-Time count is important to understand the prevalence of homelessess in the community, it does not capture the number of people that experience homelessness through a calendar year. The following section describes the number of people experiencing homelessness at the time the Point-In-Time was conducted annually in Forsyth County from 2018-2020.

Key Points

The total number of residents without children who experienced homelessness on a single night in January increased from 351 in 2018 to 427 in 2020.
Black residents disproportionately experienced homelessness from 2018-2020 (across both measures).
The total number of residents in households with at least one adult and one child present who experienced homelessness decreased from 89 in 2018 to 77 in 2020.
Male residents without children disproportionately experienced more homelessness, while female residents in households with at least one adult and one child present disproportionately experienced more homelessness.

Data Dashboards

Homeless Adults without Children

1-year Estimates

Key Points:

  • The total number of residents without children who experienced homelessness on a single night in January increased from 351 in 2018 to 427 in 2020.
  • 67 homeless females without children were identified in 2018 compared to 83 in 2020.
  • Black residents without children disproportionately experienced homelessness from 2018-2020.
  • More males than females without children experienced homelessness from 2018-2020.

Data Notes:

  • Homelessness data is from the Point-in-Time count data which is conducted annually on a single night in January and is reported to the U.S. Department of Housing and Urban Development. Estimates reflect a single point in time that data is collected and does not reflect the total number of people that may experience homelessness in a calendar year. Estimates prior to 2018 were not reported due to changing definitions in the Point-in-Time data collection.
  • Homelessness data identifies if respondents are Latinx or not-Latinx. It does not ask about ethnicity in relation to a specific racial category. For example, those who selected White as their race could be Latinx White or non-Latinx White.
  • Other racial groups include those who identify as:
  • Asian,
  • American Indian or Alaska Native, 
  • Native Hawaiian or Other Pacific Islander, and 
  • respondents who selected multiple racial categories.
  • The most recent homelessness data available is from January 2020. Current homelessness numbers may change as a result of COVID-19. For more resources on how COVID-19 may be impacting this measure, click here.
  • Source: Personal correspondence. Laura Lama (City of Winston-Salem), September 2020
  • The total number of residents without children who experienced homelessness on a single night in January increased from 351 in 2018 to 427 in 2020.
  • 67 homeless females without children were identified in 2018 compared to 83 in 2020.
  • Black residents without children disproportionately experienced homelessness from 2018-2020.
  • More males than females without children experienced homelessness from 2018-2020.
  • Homelessness data is from the Point-in-Time count data which is conducted annually on a single night in January and is reported to the U.S. Department of Housing and Urban Development. Estimates reflect a single point in time that data is collected and does not reflect the total number of people that may experience homelessness in a calendar year. Estimates prior to 2018 were not reported due to changing definitions in the Point-in-Time data collection.
  • Homelessness data identifies if respondents are Latinx or not-Latinx. It does not ask about ethnicity in relation to a specific racial category. For example, those who selected White as their race could be Latinx White or non-Latinx White.
  • Other racial groups include those who identify as:
  • Asian,
  • American Indian or Alaska Native, 
  • Native Hawaiian or Other Pacific Islander, and 
  • respondents who selected multiple racial categories.
  • The most recent homelessness data available is from January 2020. Current homelessness numbers may change as a result of COVID-19. For more resources on how COVID-19 may be impacting this measure, click here.
  • Source: Personal correspondence. Laura Lama (City of Winston-Salem), September 2020

People in Homeless Families with Children

1-year Estimates

Key Points:

  • There were 89 people in households with at least one adult and one child who experienced homelessness on a single night in January 2018 compared to 77 in January 2020.
  • 56 females in households with at least one adult and one child experienced homelessness in 2018 compared to 54 in 2020.
  • More female than male residents in households with at least one adult and one child present experienced homelessness from 2018-2020.
  • Black residents in households with at least one adult and one child present disproportionately experienced homelessness from 2018-2020.

Data Notes:

  • Homelessness data is from the Point-in-Time count data which is conducted annually on a single night in January and is reported to the U.S. Department of Housing and Urban Development. Estimates reflect a single point in time that data is collected and does not reflect the total number of people that may experience homelessness in a calendar year. Estimates prior to 2018 were not reported due to changing definitions in the Point-in-Time data collection.
  • Homelessness data identifies if respondents are Latinx or not-Latinx. It does not ask about ethnicity in relation to a specific racial category. For example, those who selected White as their race could be Latinx White or non-Latinx White.
  • Other racial groups include those who identify as:
  • Asian,
  • American Indian or Alaska Native,
  • Native Hawaiian or Other Pacific Islander, and 
  • respondents who selected multiple racial categories.
  • The most recent homelessness data available is from January 2020. Current homelessness numbers may change as a result of COVID-19. For more resources on how COVID-19 may be impacting this measure, click here.
  • Source: Personal correspondence. Laura Lama (City of Winston-Salem), September 2020
  • There were 89 people in households with at least one adult and one child who experienced homelessness on a single night in January 2018 compared to 77 in January 2020.
  • 56 females in households with at least one adult and one child experienced homelessness in 2018 compared to 54 in 2020.
  • More female than male residents in households with at least one adult and one child present experienced homelessness from 2018-2020.
  • Black residents in households with at least one adult and one child present disproportionately experienced homelessness from 2018-2020.
  • Homelessness data is from the Point-in-Time count data which is conducted annually on a single night in January and is reported to the U.S. Department of Housing and Urban Development. Estimates reflect a single point in time that data is collected and does not reflect the total number of people that may experience homelessness in a calendar year. Estimates prior to 2018 were not reported due to changing definitions in the Point-in-Time data collection.
  • Homelessness data identifies if respondents are Latinx or not-Latinx. It does not ask about ethnicity in relation to a specific racial category. For example, those who selected White as their race could be Latinx White or non-Latinx White.
  • Other racial groups include those who identify as:
  • Asian,
  • American Indian or Alaska Native,
  • Native Hawaiian or Other Pacific Islander, and 
  • respondents who selected multiple racial categories.
  • The most recent homelessness data available is from January 2020. Current homelessness numbers may change as a result of COVID-19. For more resources on how COVID-19 may be impacting this measure, click here.
  • Source: Personal correspondence. Laura Lama (City of Winston-Salem), September 2020

Incarceration

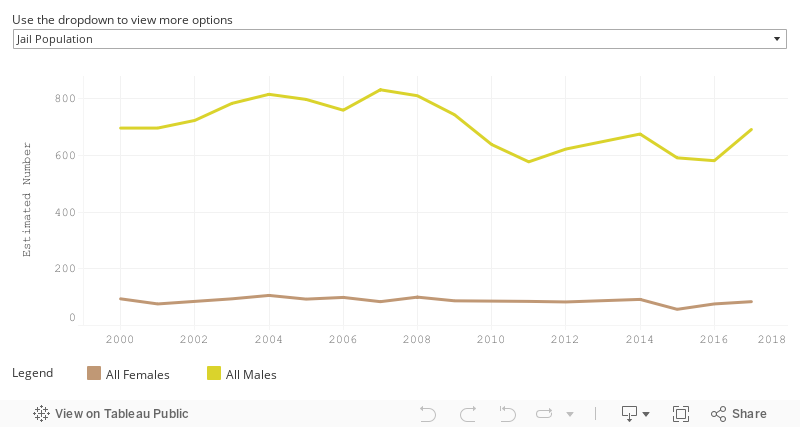
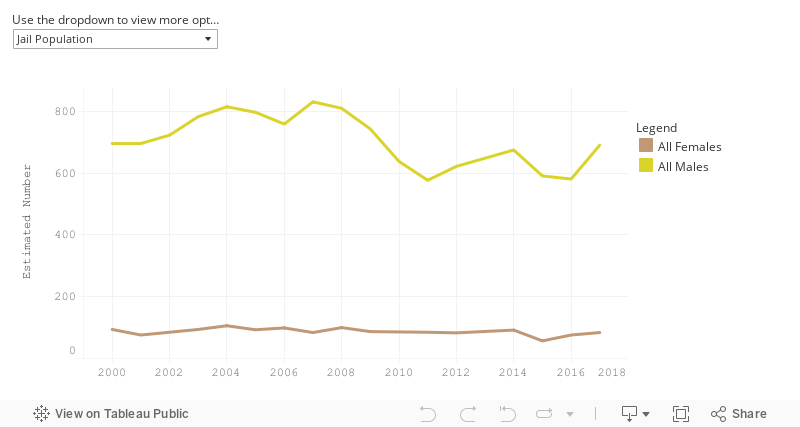
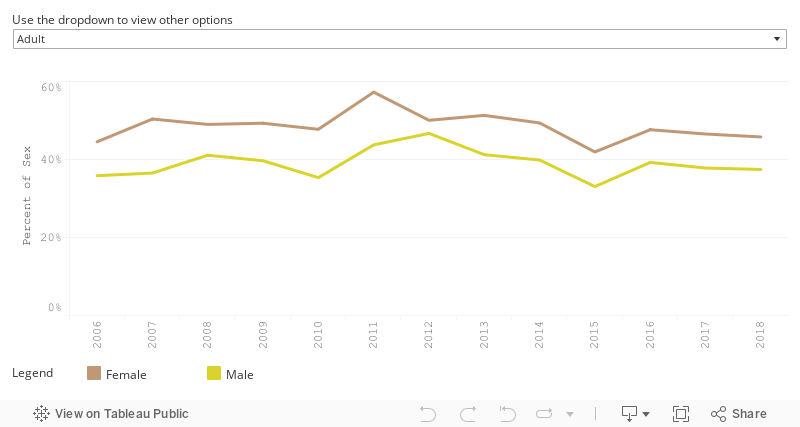
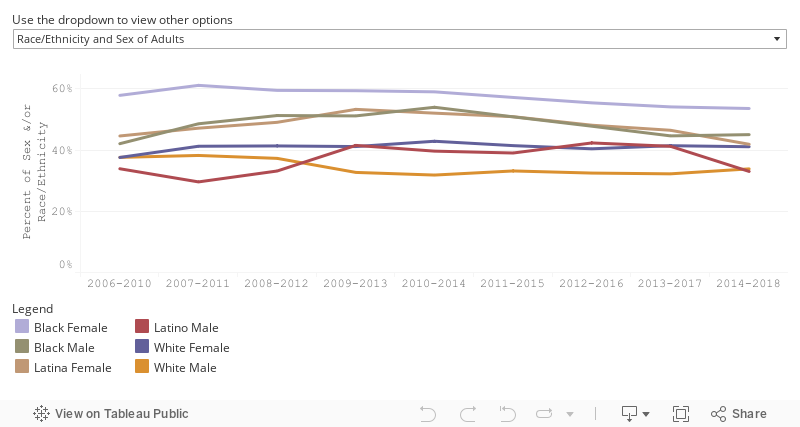
Information on incarcerated people in Forsyth County is included in this report because incarcerated people are considered Forsyth County residents during their period of incarceration. People who are incarcerated in Forsyth County or admitted to prison from Forsyth County courts may or may not have been Forsyth County residents prior to their incarceration and may or may not stay in Forsyth County after their incarceration; due to this fact, it is difficult to make conclusions about how these incarceration rates impact the economic status of local residents.

Key Points

During 2016, a daily average of 76 females were incarcerated in Forsyth County jails, and 84 were incarcerated in Forsyth County prisons.
Of the women incarcerated in prisons, 35 were White, 42 were Black, and 5 were Latina.

Data Dashboards

Incarcerated Individuals

1-year Estimates

Key Points:

  • People who are incarcerated in Forsyth County or admitted to prison from Forsyth County courts may or may not have been Forsyth County residents prior to their incarceration and may or may not stay in Forsyth County after their incarceration; due to this fact, it is difficult to make conclusions about how these incarceration rates impact the economic status of local residents.
  • Incarceration data is included in this report to provide information on the number of incarcerated people in Forsyth County because incarcerated people are considered Forsyth County residents during their period of incarceration.

Data Notes:

  • Jail population data was not available by race/ethnicity and gender together.
  • Jail population data represents the daily average number of incarcerated people over the course of the year and may use decimal points because it is an average.
  • Jail population data was not available by race/ethnicity and gender together. 
  • Prison population data is based on the number of people held in prison on December 31 of that year. 
  • Prison admissions with a sentence of less than 12 months are excluded from this data. 
  • Residents incarcerated in jails and prisons or admitted to prison from the Forsyth County court system may or not be Forsyth County Residents.
  • Source: Vera Institute of Justice Incarceration Trends Dataset
  • People who are incarcerated in Forsyth County or admitted to prison from Forsyth County courts may or may not have been Forsyth County residents prior to their incarceration and may or may not stay in Forsyth County after their incarceration; due to this fact, it is difficult to make conclusions about how these incarceration rates impact the economic status of local residents.
  • Incarceration data is included in this report to provide information on the number of incarcerated people in Forsyth County because incarcerated people are considered Forsyth County residents during their period of incarceration.
  • Jail population data was not available by race/ethnicity and gender together.
  • Jail population data represents the daily average number of incarcerated people over the course of the year and may use decimal points because it is an average.
  • Jail population data was not available by race/ethnicity and gender together. 
  • Prison population data is based on the number of people held in prison on December 31 of that year. 
  • Prison admissions with a sentence of less than 12 months are excluded from this data. 
  • Residents incarcerated in jails and prisons or admitted to prison from the Forsyth County court system may or not be Forsyth County Residents.
  • Source: Vera Institute of Justice Incarceration Trends Dataset

References

  1. The Pew Charitable Trusts. (2018, April 19). American Families Face a Growing Rent Burden. https://www.pewtrusts.org/en/research-and-analysis/reports/2018/04/american-families-face-a-growing-rent-burden
  2. Addo, F. R., & Lichter, D. T. (2013). Marriage, marital history, and black–white wealth differentials among older women. Journal of Marriage and Family, 75(2), 342-362.
  3. Shapiro, T. M. (2004). The hidden cost of being African American: How wealth perpetuates inequality. Oxford University Press.
  4. Hirschl, T. A., & Rank, M. R. (2010). Homeownership across the American life course: Estimating the racial divide. Race and Social Problems, 2(3-4), 125-136.
  5. United States Interagency Council on Homelessness. (2015, June). Opening doors: Federal strategic plan to prevent and end homelessness. https://www.usich.gov/resources/uploads/asset_library/USICH_OpeningDoors_Amendment2015_FINAL.pdf.