Through a Gender Lens

Business and Employment

Business and Employment opportunities are important factors in residents’ financial security. This section looks at residents’ employment status, occupational field, and female-owned businesses in Forsyth County.

Glossary terms used in this section: Disparity, Full-Time Work, Median, and Labor Force

Key Findings

Unemployment rates for adult males and females were generally similar, but there were significant racial disparities in unemployment.

From 2014-2018, the unemployment rate of Black and Latina females was more than twice that of White females.
Among working adults, males were consistently more likely to work at least 30 hours per week than females.
Placing one child in an average-cost childcare facility would require roughly 10-12% of the median household income for married couple households and 25-30% of the median household income for female-headed households, which may provide a significant cost burden or barrier to employment for some families.
Females were less likely to be employed than males in three of the six occupational categories with the highest median incomes from 2014-2018: architecture and engineering, computer and mathematical, and management.

Females working in two of the six categories, management and healthcare practitioners and technical, have lower median incomes than males working in those same occupational fields.
Underrepresentation in high-paying occupational fields and lower-paying jobs within those fields may contribute to females having lower median incomes than men.
In 2017, males owned the majority (67%) of businesses in Forsyth County.  

Females owned 21% of businesses and 13% of businesses were owned jointly by males and females.

Employment and Underemployment

Employment is critical to earning the income that supports individuals and families. This section looks at the percentage of working-age residents who are participating in the labor force, residents who are employed full time, and residents who are unemployed.

Glossary terms used in this section: Labor Force

Key Points

In Forsyth County, a higher percentage of males between the ages of 18 and 65 participated in the labor force than women.

Latino males had the highest rates of labor force participation, followed by White males. Latina females have the lowest rates of labor force participation.
Unemployment rates for adult males and females are generally similar, but there are significant racial disparities in unemployment.

From 2014-2018, the unemployment rate of Black and Latina females was more than twice that of White females.
Among working adults, males are consistently more likely to work at least 30 hours per week than females.

Data Dashboards

Labor Force Participation

1-year Estimates

5-year Estimates

Key Points:

  • Overall, males in Forsyth County have had higher labor force participation rates from 2006-2018. In 2018, about 76% of males aged 18-65 participated in the labor force compared to about 70% of females.
  • When looking at racial and ethnic differences in labor force participation rates among females, there is not much variation in the 2018 1-year estimates (between 1-3%). Since the 5-year samples are the averages across each year included, there are significant differences among females from 2014-2018. About 63% of Latina females participated in the labor force during that time period compared to 72% of Black females and 71% of White females.
  • Latino males have the highest rates of labor force participation, followed by White males; Latina females have the lowest rates of labor force participation. Between 2014-2018, an estimated 86% of Latino males participated in the labor force, compared to 80% of White males, and 63% of Latina females. During that time period, Black females, Black males, and White females had similar rates of labor force participation (between 71% and 72%).

Data Notes:

  • The labor force participation rate measures the percentage of Forsyth County residents between the ages of 18 and 65 who are employed or unemployed and actively looking for work. Residents who are not working because they are students, staying home with children, disabled, or retired are not classified as being in the labor force.
  • The most recent poverty data available is from 2018. Current poverty rates are likely to be higher as a result of COVID-19. For more resources on how COVID-19 may be impacting this measure, click here.
  • Source: U.S. Census Bureau American Community Survey (ACS) 1- and 5-year Public Use Microdata Samples
  • Overall, males in Forsyth County have had higher labor force participation rates from 2006-2018. In 2018, about 76% of males aged 18-65 participated in the labor force compared to about 70% of females.
  • When looking at racial and ethnic differences in labor force participation rates among females, there is not much variation in the 2018 1-year estimates (between 1-3%). Since the 5-year samples are the averages across each year included, there are significant differences among females from 2014-2018. About 63% of Latina females participated in the labor force during that time period compared to 72% of Black females and 71% of White females.
  • Latino males have the highest rates of labor force participation, followed by White males; Latina females have the lowest rates of labor force participation. Between 2014-2018, an estimated 86% of Latino males participated in the labor force, compared to 80% of White males, and 63% of Latina females. During that time period, Black females, Black males, and White females had similar rates of labor force participation (between 71% and 72%).
  • The labor force participation rate measures the percentage of Forsyth County residents between the ages of 18 and 65 who are employed or unemployed and actively looking for work. Residents who are not working because they are students, staying home with children, disabled, or retired are not classified as being in the labor force.
  • The most recent poverty data available is from 2018. Current poverty rates are likely to be higher as a result of COVID-19. For more resources on how COVID-19 may be impacting this measure, click here.
  • Source: U.S. Census Bureau American Community Survey (ACS) 1- and 5-year Public Use Microdata Samples

Individuals in Workforce Full Time

1-year Estimates

5-year Estimates

Key Points:

  • A higher percentage of working males in Forsyth County consistently had full-time work than females.
  • The rate of females working full-time was the lowest at 77%, in 2011, 2015, and 2016, and increased to 82% in 2018.
  • For the 2006-2010 and 2010-2014 periods, working Black females had higher rates of working full time compared to White females; however, for the most recent 5-year period (2014-2018) Black and White females did not have significant differences in working full time. Latina females have had the highest variability in working full-time.

Data Notes:

  • A higher percentage of working males in Forsyth County consistently had full-time work than females.
  • The rate of females working full-time was the lowest at 77%, in 2011, 2015, and 2016, and increased to 82% in 2018.
  • For the 2006-2010 and 2010-2014 periods, working Black females had higher rates of working full time compared to White females; however, for the most recent 5-year period (2014-2018) Black and White females did not have significant differences in working full time. Latina females have had the highest variability in working full-time.

Unemployment Rate for Individuals

1-year Estimates

5-year Estimates

Key Points:

  • Unemployment rates were not significantly different between females and males except from 2012-2013, when unemployment was higher for males.
  • The unemployment rate for females peaked at about 11% in 2014. That unemployment rate for females was significantly different from the unemployment rate from 2015-2018 when it began to decrease. In 2018, about 5% of adult females were unemployed.
  • Racial disparities in unemployment were significant in Forsyth County. From 2006-2010, the percentage of Black unemployed females was twice as high as the percentage of White unemployed females. That disparity persisted, with 11% of Black females unemployed from 2014-2018 compared to 4% of White females during the same time.
  • Additionally, in the most recent 5-year period (2014-2018) Latina females experienced a significantly higher unemployment rate compared to White females (9% compared to 4%, respectively). Latino males experienced unemployment rates similar to those of White males and females.

Data Notes:

  • The unemployment rate is calculated as the percentage of adult civilian residents who are unemployed and actively seeking a job. Residents who are retired, disabled, students, in the military, or not working in order to care for other family members are not included in this estimate.
  • 1-year estimates vary in margin of error; using the 5-year data for estimates of unemployment by race/ethnicity and sex is recommended.
  • The most recent local data available that is broken down by race/ethnicity and sex is from 2018. Current unemployment rates are likely higher as a result of COVID-19. For more resources on how COVID-19 may be impacting this measure, click here.
  • Source: U.S. Census Bureau American Community Survey (ACS) 1- and 5-year Public Use Microdata Samples
  • Unemployment rates were not significantly different between females and males except from 2012-2013, when unemployment was higher for males.
  • The unemployment rate for females peaked at about 11% in 2014. That unemployment rate for females was significantly different from the unemployment rate from 2015-2018 when it began to decrease. In 2018, about 5% of adult females were unemployed.
  • Racial disparities in unemployment were significant in Forsyth County. From 2006-2010, the percentage of Black unemployed females was twice as high as the percentage of White unemployed females. That disparity persisted, with 11% of Black females unemployed from 2014-2018 compared to 4% of White females during the same time.
  • Additionally, in the most recent 5-year period (2014-2018) Latina females experienced a significantly higher unemployment rate compared to White females (9% compared to 4%, respectively). Latino males experienced unemployment rates similar to those of White males and females.
  • The unemployment rate is calculated as the percentage of adult civilian residents who are unemployed and actively seeking a job. Residents who are retired, disabled, students, in the military, or not working in order to care for other family members are not included in this estimate.
  • 1-year estimates vary in margin of error; using the 5-year data for estimates of unemployment by race/ethnicity and sex is recommended.
  • The most recent local data available that is broken down by race/ethnicity and sex is from 2018. Current unemployment rates are likely higher as a result of COVID-19. For more resources on how COVID-19 may be impacting this measure, click here.
  • Source: U.S. Census Bureau American Community Survey (ACS) 1- and 5-year Public Use Microdata Samples

Sex-segregated Occupational Groups

Some fields of employment have higher median incomes than others. Gender-based disparities in representation in these fields may impact women’s income and economic security. This analysis looks at the median incomes of Forsyth County residents working in different occupational fields, as well as the percentage of residents working in each field by sex, to identify which fields and occupations in Forsyth County have the highest median incomes, how likely males and females are to be employed in those fields, and what the median incomes of males and females working in those fields are locally. All of the fields and occupational groups in this analysis are defined based on the highest-level categories of the Standard Occupational Classification (SOC) system from the US Bureau of Labor Statistics. Examples of specific occupations falling in each category can be found in the 2018 SOC structure document provided by the U.S. Bureau of Labor Statistics.

Glossary terms used in this section: Median

Key Points

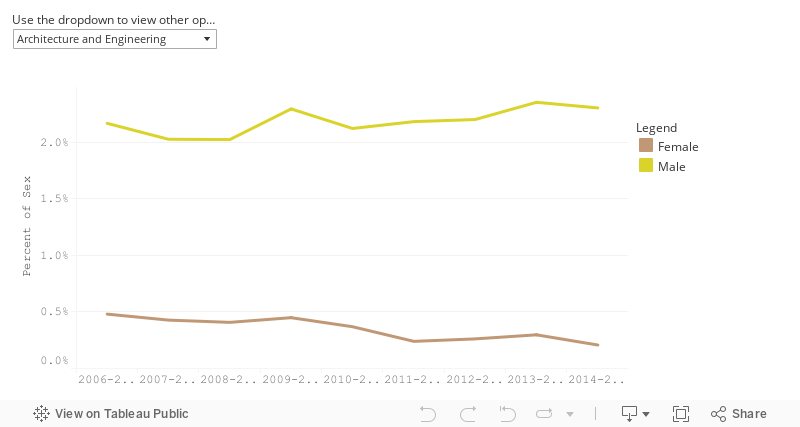
Females were less likely to be employed than males in three of the six occupational categories that had the highest median incomes from 2014-2018: architecture and engineering, computer and mathematical, and management.
In two of the six occupational categories with the highest median incomes from 2014-2018, management and healthcare practitioners and technical, females had significantly lower median incomes than males.

These occupational categories are broad and contain specific occupations with varying salaries; for example, healthcare practitioners and technical includes both nurses and surgeons. As a result, some of the difference in median income could be caused by females being more likely to have lower-paying jobs within that category.
Females were less likely to be employed in high-earning fields and women working full time in high-earning fields earned less.

While this could be due to over-representation in lower-paying jobs within those fields, or other differences in pay, this cause was not analyzed. This could also contribute to females and female-headed households having lower rates of economic security compared to other household compositions.

Data Dashboards

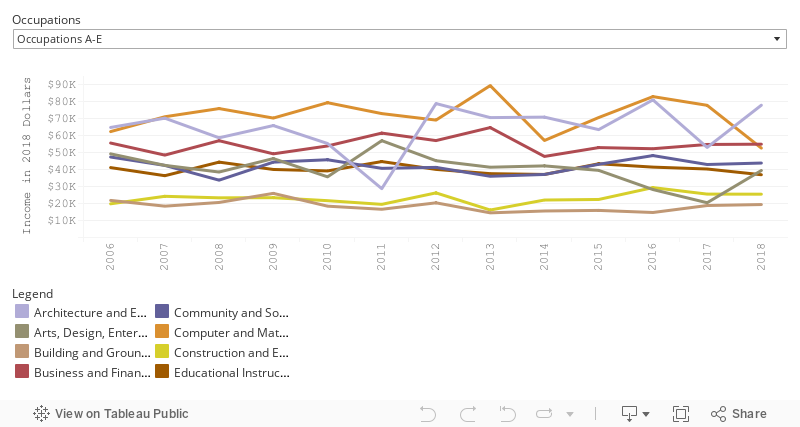
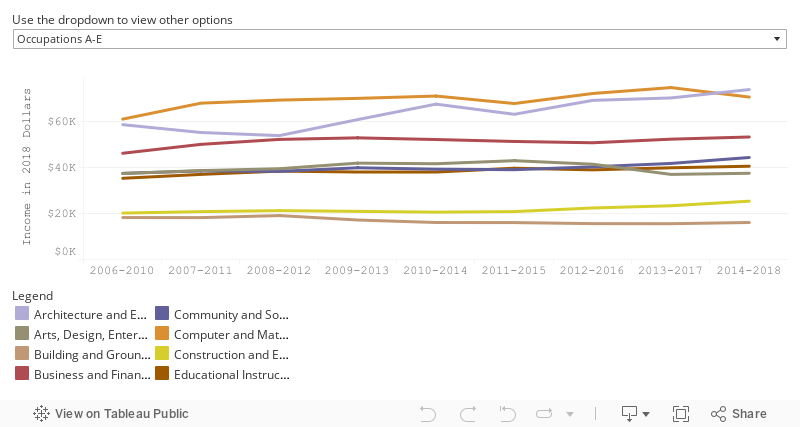
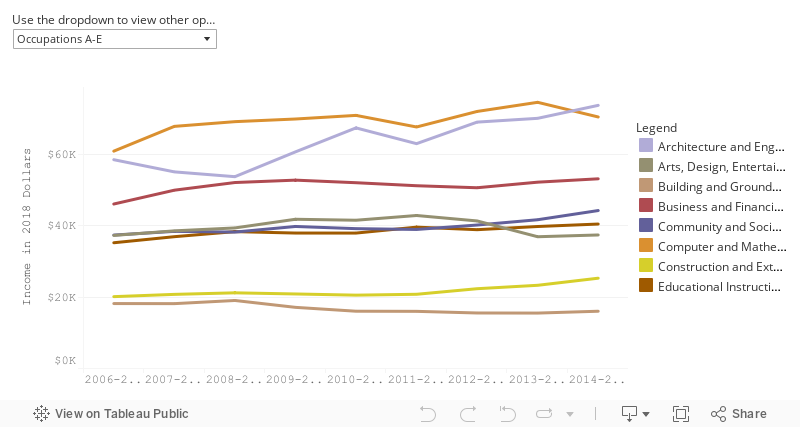
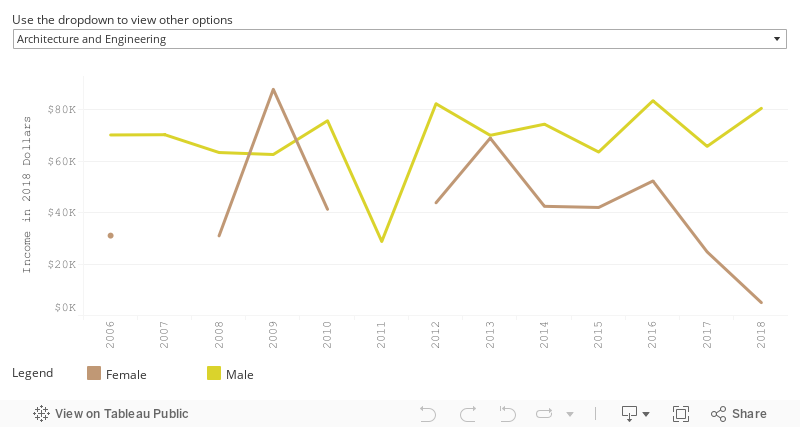
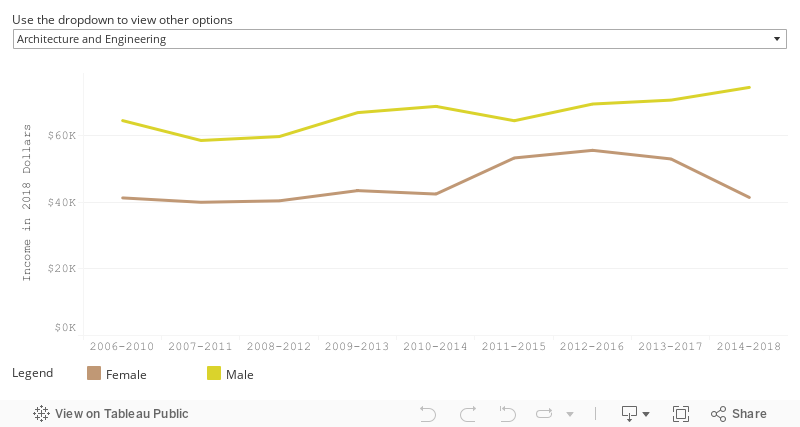
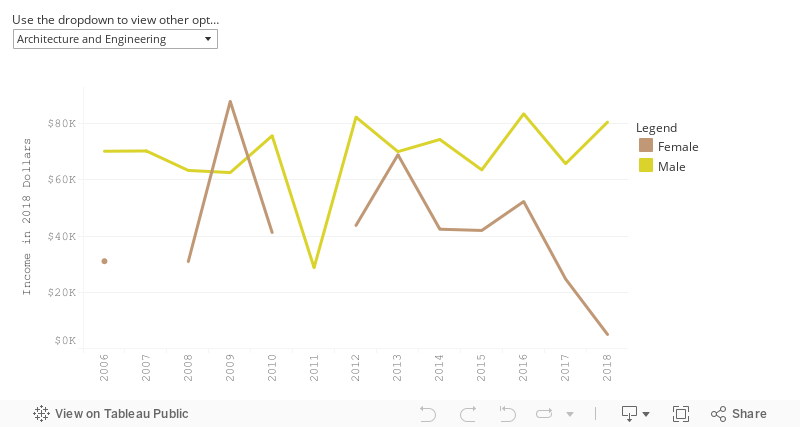
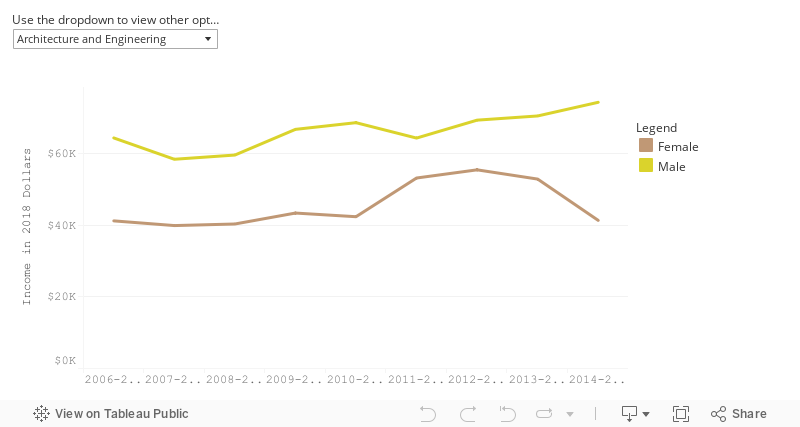
Median Income by Field

1-year Estimates

5-year Estimates

Key Points:

  • This data is here to provide context for the other analyses. It does not have its own key points.

Data Notes:

  • Some data may be missing from these graphs.
  • Broad field categories are based on the Standard Occupation Classification codes from the US Bureau of Labor Statistics.
  • All dollar amounts are expressed in 2018 dollars to control for inflation.
  • The most recent income data available is from 2018. Current income data may change as a result of COVID-19. For more resources on how COVID-19 may be impacting this measure, click here.
  • Source: U.S. Census Bureau American Community Survey (ACS) 1- and 5-year Public Use Microdata Samples
  • Margins of error for some estimates are high; the 5-year estimates are generally more reliable than the 1-year estimates.
  • This data is here to provide context for the other analyses. It does not have its own key points.
  • Some data may be missing from these graphs.
  • Broad field categories are based on the Standard Occupation Classification codes from the US Bureau of Labor Statistics.
  • All dollar amounts are expressed in 2018 dollars to control for inflation.
  • The most recent income data available is from 2018. Current income data may change as a result of COVID-19. For more resources on how COVID-19 may be impacting this measure, click here.
  • Source: U.S. Census Bureau American Community Survey (ACS) 1- and 5-year Public Use Microdata Samples
  • Margins of error for some estimates are high; the 5-year estimates are generally more reliable than the 1-year estimates.

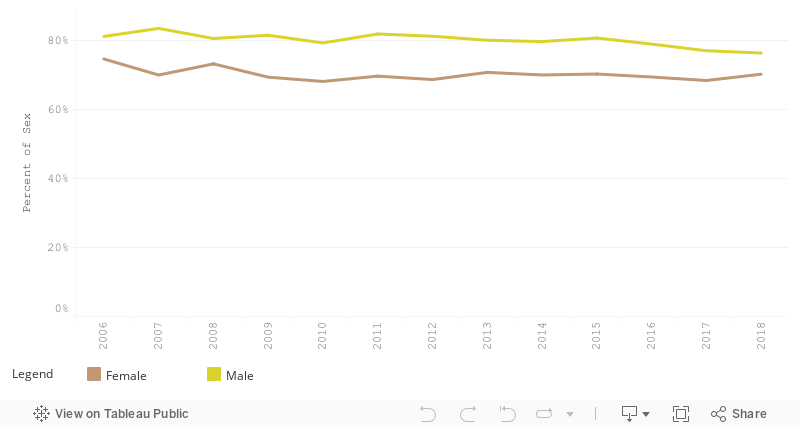
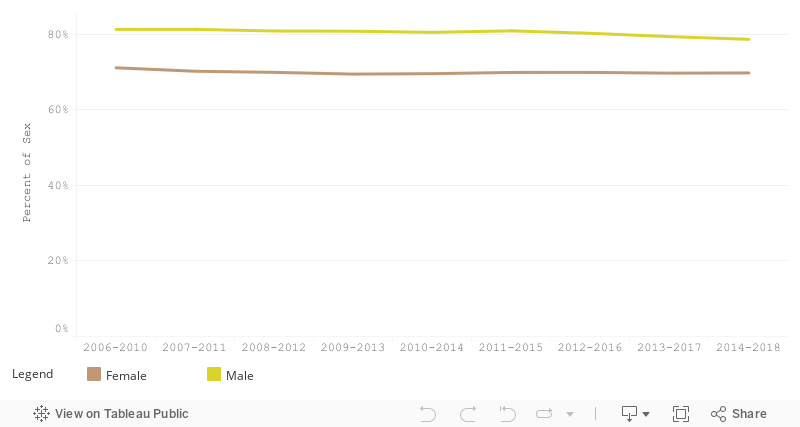
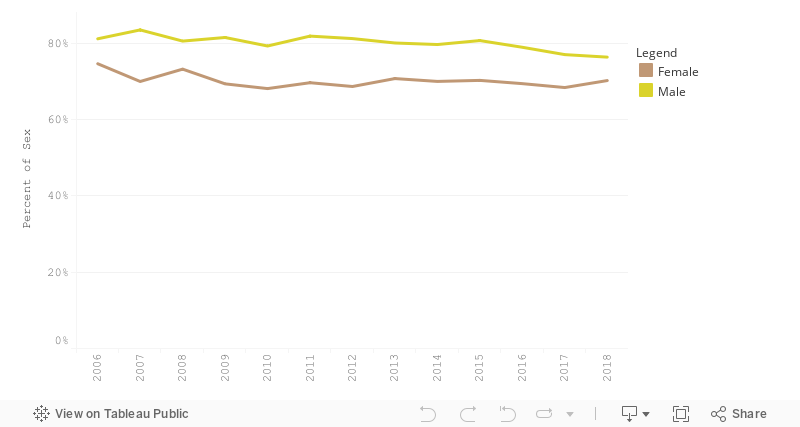
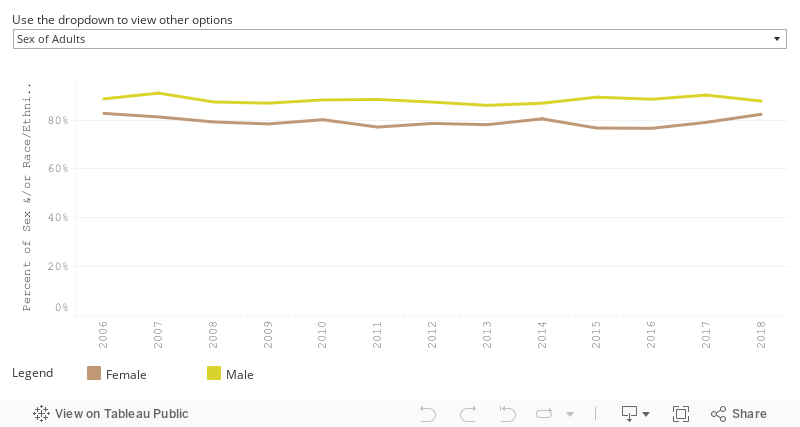
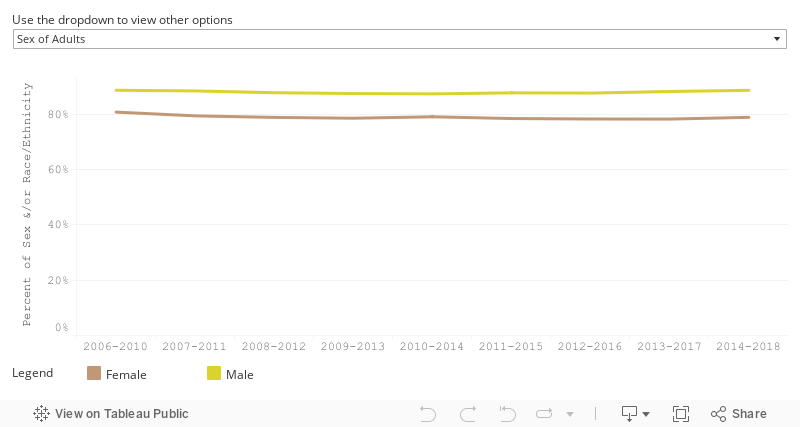
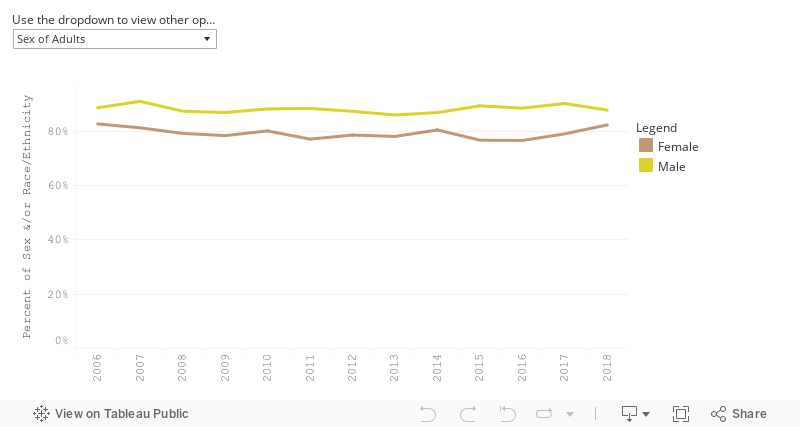
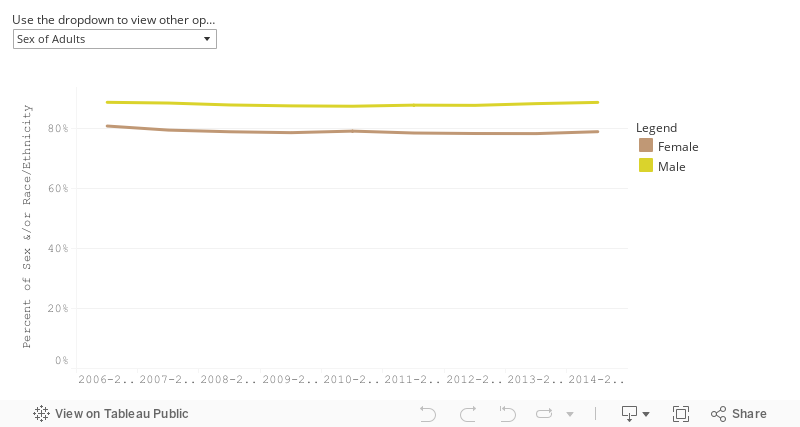
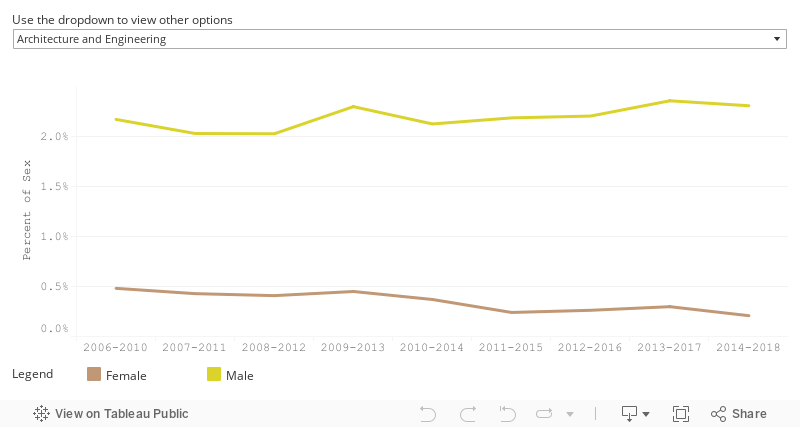
Individuals Working in Different Fields

5-year Estimates

Key Points:

  • This data is here to provide context for the other analyses. It does not have its own key points.

Data Notes:

  • Some data may be missing from these graphs.
  • Broad field categories are based on the Standard Occupation Classification codes from the US Bureau of Labor Statistics.
  • All dollar amounts are expressed in 2018 dollars to control for inflation.
  • The most recent income data available is from 2018. Current income data may change as a result of COVID-19. For more resources on how COVID-19 may be impacting this measure, click here.
  • Source: U.S. Census Bureau American Community Survey (ACS) 1- and 5-year Public Use Microdata Samples
  • Margins of error for some estimates are high; the 5-year estimates are generally more reliable than the 1-year estimates.
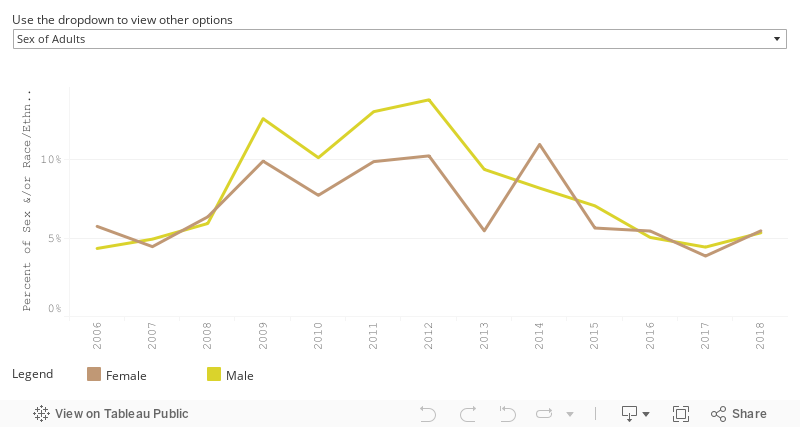
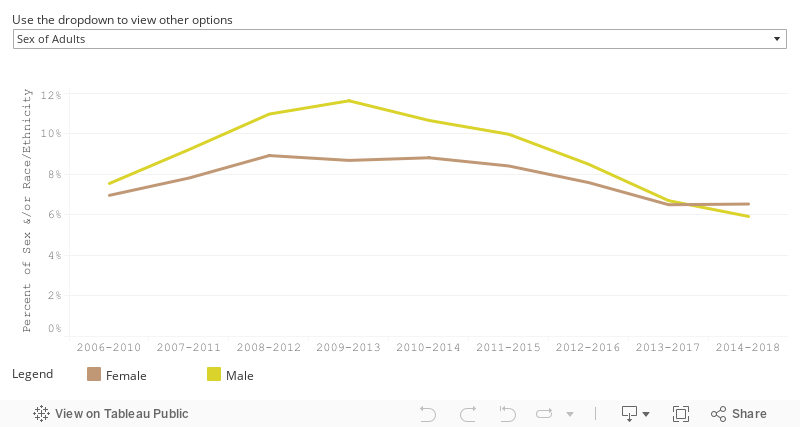
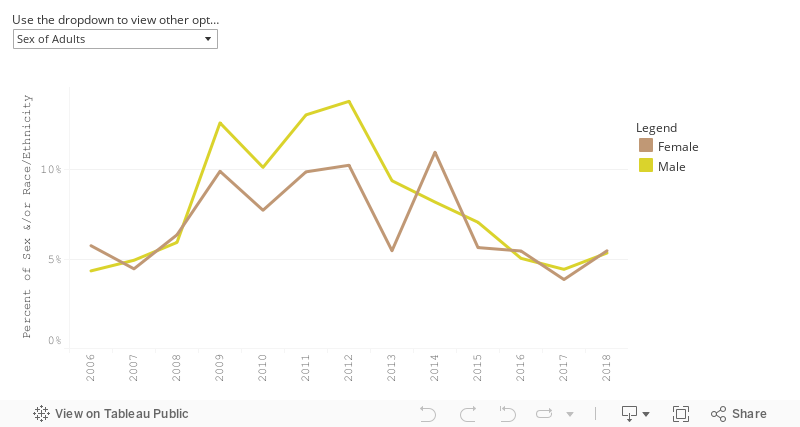
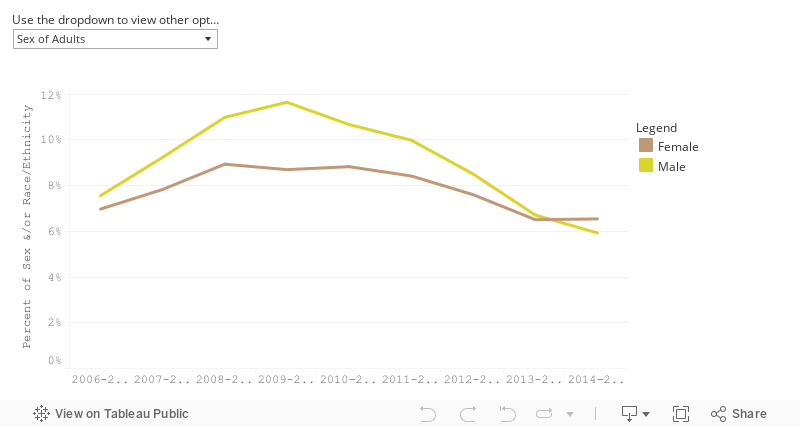
  • From 2014-2018, the following occupational categories had the largest differences between rates of female participation and male participation:
  • Females were more likely than males to be employed in the following fields:
  • educational instruction and library: females (10%), males (3%)
  • healthcare practitioners and technical: females (11%), males (4%)
  • office and administrative support: females (18%), males (6%)
  • Males were more likely than females to be employed in the following fields:
  • construction and extraction: females (0%), males (9%)
  • installation and maintenance/repair: females (0%), males (5%)
  • production: females (4%), males (9%)
  • transportation and material moving: females (3%), males (11%)
  • Of the 6 (out of 23) broad occupational categories with the highest median incomes in Forsyth County from 2014-2018, females were less likely than males to be employed in 3 of the 6: architecture and engineering, computer and mathematical, and management. Females were more likely than males to be employed in only one of these categories: healthcare practitioners and technical.
  • Of the 6 (out of 23) broad occupational categories with the lowest median incomes in Forsyth County from 2014-2018, females were more likely than males to work in 2 of the 6: healthcare support and personal care and services. Females were less likely than males to be employed in only one of these categories: construction and extraction.
  • Residents under the age of 18 and residents who have not worked in the past five years were excluded from this analysis.
  • Both 1-year and 5-year data samples were too small to calculate occupation by race/ethnicity.
  • Broad field categories are based on the Standard Occupation Classification codes from the US Bureau of Labor Statistics. Examples of specific occupations falling in each category can be found in the 2018 SOC structure document provided by the U.S. Bureau of Labor Statistics.
  • The most recent employment data available is from 2018. Current employment data may change as a result of COVID-19. For more resources on how COVID-19 may be impacting this measure, click here.
  • Source: U.S. Census Bureau American Community Survey (ACS) 1- and 5-year Public Use Microdata Samples

Median Income of Different Fields

1-year Estimates

5-year Estimates

Key Points:

  • Males generally have higher median incomes across most occupational categories in the 5-year data (compared to females in the same occupation); however, some of these differences are within the margin of error.
  • From 2014-2018, males had significantly higher incomes in the following occupational categories:
  • business and financial operations: females (~$47,000), males (~$70,000)
  • healthcare practitioners and technical: females (~$51,000), males (~$69,000)
  • legal: females (~$41,000), males (~$93,000)
  • management: females (~$54,000), males (~$70,000)
  • office and administrative support: females (~$32,000), males (~$37,000)
  • production: females (~$24,000), males (~$33,000)
  • sales and related: females (~$26,000), males (~$41,000)
  • Transportation and material moving: females (~$21,000), males (~$27,000)
  • There were no occupational categories in which females earned significantly more than males.
  • Of the 6 (out of 23) broad occupational categories with the highest median incomes in Forsyth County from 2014-2018, females working in 2 of the 6 occupational categories (healthcare practitioners and technical and management) had significantly lower median incomes than males, despite working in an occupational category that is typically higher earning.

Data Notes:

  • Residents under the age of 18, residents who have not worked in the past five years, and residents working fewer than 30 hours per week were excluded from this analysis.
  • All dollar amounts are expressed in 2018 dollars to control for inflation.
  • Broad field categories are based on the Standard Occupation Classification codes from the US Bureau of Labor Statistics.
  • 1-year and 5-year data samples were both too small to calculate occupation by race/ethnicity.
  • Analysts caution against interpreting the income gap between males and females in these occupational categories given the broad nature of the categories (e.g. residents in the legal occupation category include those with jobs that range from paralegals and legal assistants to lawyers and judges).
  • All dollars are expressed in 2018 dollars to control for inflation.
  • The most recent income data available is from 2018. Current income data may change as a result of COVID-19. For more resources on how COVID-19 may be impacting this measure, click here.
  • Source: U.S. Census Bureau American Community Survey (ACS) 1- and 5-year Public Use Microdata Samples
  • Males generally have higher median incomes across most occupational categories in the 5-year data (compared to females in the same occupation); however, some of these differences are within the margin of error.
  • From 2014-2018, males had significantly higher incomes in the following occupational categories:
  • business and financial operations: females (~$47,000), males (~$70,000)
  • healthcare practitioners and technical: females (~$51,000), males (~$69,000)
  • legal: females (~$41,000), males (~$93,000)
  • management: females (~$54,000), males (~$70,000)
  • office and administrative support: females (~$32,000), males (~$37,000)
  • production: females (~$24,000), males (~$33,000)
  • sales and related: females (~$26,000), males (~$41,000)
  • Transportation and material moving: females (~$21,000), males (~$27,000)
  • There were no occupational categories in which females earned significantly more than males.
  • Of the 6 (out of 23) broad occupational categories with the highest median incomes in Forsyth County from 2014-2018, females working in 2 of the 6 occupational categories (healthcare practitioners and technical and management) had significantly lower median incomes than males, despite working in an occupational category that is typically higher earning.
  • Residents under the age of 18, residents who have not worked in the past five years, and residents working fewer than 30 hours per week were excluded from this analysis.
  • All dollar amounts are expressed in 2018 dollars to control for inflation.
  • Broad field categories are based on the Standard Occupation Classification codes from the US Bureau of Labor Statistics.
  • 1-year and 5-year data samples were both too small to calculate occupation by race/ethnicity.
  • Analysts caution against interpreting the income gap between males and females in these occupational categories given the broad nature of the categories (e.g. residents in the legal occupation category include those with jobs that range from paralegals and legal assistants to lawyers and judges).
  • All dollars are expressed in 2018 dollars to control for inflation.
  • The most recent income data available is from 2018. Current income data may change as a result of COVID-19. For more resources on how COVID-19 may be impacting this measure, click here.
  • Source: U.S. Census Bureau American Community Survey (ACS) 1- and 5-year Public Use Microdata Samples

Female-owned Businesses

The numbers of female-owned businesses can help us understand the leadership roles held by women in the local economy. This indicator measures the percentage of businesses that are owned by males, by females, or by both males and females.

Key Points

In 2017, males owned the majority (67%) of businesses in Forsyth County, while females owned 21% of businesses, and 13% of businesses were shared by males and females.

Data Dashboards

Business Ownership, 2017

1-year Estimates

Key Points:

  • In 2017, males represented the majority of business owners at 67%, while females owned 21% of businesses and 13% of businesses were shared by males and females.

Data Notes:

  • This data comes from a new Census Bureau survey, and only 2017 data is currently available. However, the Census Bureau intends to update this data annually.
  • Current business ownership data may change as a result of COVID-19. For more resources on how COVID-19 may be impacting this measure, click here.
  • In 2017, males represented the majority of business owners at 67%, while females owned 21% of businesses and 13% of businesses were shared by males and females.
  • This data comes from a new Census Bureau survey, and only 2017 data is currently available. However, the Census Bureau intends to update this data annually.
  • Current business ownership data may change as a result of COVID-19. For more resources on how COVID-19 may be impacting this measure, click here.

Childcare Rates

Childcare can be a major expense for households, especially households with multiple children. For families without alternative childcare options (such as grandparents), childcare is required to participate in the labor force, especially if both parents (or an only parent) needs to work to meet their family’s financial needs.

Glossary terms used in this section: Median

Key Points

Placing one child in an average-cost childcare facility would require roughly 10%-12% of the median household income for married couple households and 25%-30% of the median household income for female-headed households, which could pose a significant cost burden or barrier to employment for some families.

Data Dashboards

Average Childcare Costs, 2020

Tabular Data

Licensed Childcare Centers
Weekly
Monthly
Birth-12 Months
$194.59
$842.59
1 Year Old
2 Years Old
$823.65
$190.51
3 Years Old
$761.16
4 or 5 Years Old
$175.89
$701.97
School Age
$162.68
$695.08
$160.40
$137.41
$594.07
Licensed Family Child Care Homes
Weekly
Monthly
Birth-12 Months
$172.08
$745.12
1 Year Old
2 Years Old
$732.89
$169.26
3 Years Old
$721.65
4 or 5 Years Old
$166.83
$697.68
School Age
$161.13
$688.59
$159.02
$136.76
$591.02

Key Points:

  • In 2017, males represented the majority of business owners at 67%, while females owned 21% of businesses and 13% of businesses were shared by males and females.

Data Notes:

  • This data comes from a new Census Bureau survey, and only 2017 data is currently available. However, the Census Bureau intends to update this data annually.
  • Current business ownership data may change as a result of COVID-19. For more resources on how COVID-19 may be impacting this measure, click here.
Licensed Childcare Centers
Weekly
Monthly
Birth-12 Months
$194.59
$842.59
1 Year Old
2 Years Old
$823.65
$190.51
3 Years Old
$761.16
4 or 5 Years Old
$175.89
$701.97
School Age
$162.68
$695.08
$160.40
$137.41
$594.07
Licensed Family Child Care Homes
Weekly
Monthly
Birth-12 Months
$172.08
$745.12
1 Year Old
2 Years Old
$732.89
$169.26
3 Years Old
$721.65
4 or 5 Years Old
$166.83
$697.68
School Age
$161.13
$688.59
$159.02
$136.76
$591.02
  • The cost of childcare locally and across the country places a significant financial burden on families, especially those with limited resources. The table shows the weekly and monthly average childcare costs in both licensed childcare centers and family childcare homes. The Division of Child Development and Early Education of the North Carolina Department of Health and Human Services (DHHS) sets the regulations for childcare providers (Source: https://ncchildcare.ncdhhs.gov/Services/Licensing/Child-Care-License-Overview).
  • Comparing these average 2020 childcare rates to the most recent household income data (2018), placing one child in an average-cost childcare facility would require roughly 10%-12% of the median household income for married couples and 25%-30% of the median household income for female-headed households without a spouse present, which may pose a significant cost burden for families.
  • Source: Personal correspondence. Katura W. Jackson (Work Family Resource Center), June 2020.

References

No additional references for content on this page.