Economic Self Sufficiency

Economic self-sufficiency focuses on whether or not residents are earning enough income to be able to afford their basic needs, as well as other factors that influence residents’ ability to afford their basic needs.
Through a Gender Lens

Key Findings

Adult females had consistently higher rates of poverty than adult males.

On average, from 2014-2018, an estimated 16% of adult females experienced poverty compared to about 13% of adult males. During the same time period, about 29% of female children and 26% of male children experienced poverty (these estimates for child poverty are within the margin of error).
Regardless of sex, Black and Latinx residents had higher rates of poverty than White residents.
Black and Latinx adults and children had higher rates of income insufficiency than White adults and children.

The income insufficiency rates of Black and Latinx adults and children were generally at least twice those of White adults and children.
Children had higher income insufficiency rates than adults.

About 50% of female children lived in households with insufficient incomes, compared to about 33% percent of adult females.
From 2014-2018, the median income for adult females working full time was 89% of that of adult males, with females earning a median of about $34,148 dollars and males earning a median of $38,342.
The median income for White females from 2014-2018 was 82% of the median income for White males, but the median income of Black and Latina females was 60% and 44% of the median income for White males, respectively.
As the level of education increased, the disparity between male and female median incomes generally increased as well.

For example, males with a high school diploma or GED as their highest level of education had a median income $10,000 more than that of females with the same level of education (~$35k vs ~$25k, respectively), but males with more than a bachelor’s degree as their highest level of education had a median income that is almost twice that of females with the same level of education (~$100k vs ~55k, respectively).
From 2014-2018, married-couple households had about twice the median income of households with male or female householders living alone or without spouses.

According to the census classification of household types, households with unmarried householders include multiple residents (e.g. children) and householders living alone do not; having a lower median income could make it particularly difficult for these households to maintain financial stability.

Poverty and Concentrated Poverty

Poverty and concentrated poverty are important economic indicators for any community. The U.S. Census Bureau sets the thresholds for who is considered to be experiencing poverty; these thresholds are based on income prior to taxes or tax credits [1]. Poverty thresholds vary by family size and by ages of family members; thresholds are adjusted annually to reflect changes in the consumer price index. For example, a family of four with two children under the age of 18 has a poverty threshold of $25,465. If the total household income was $25,500, then that family would not be considered to be experiencing poverty. 

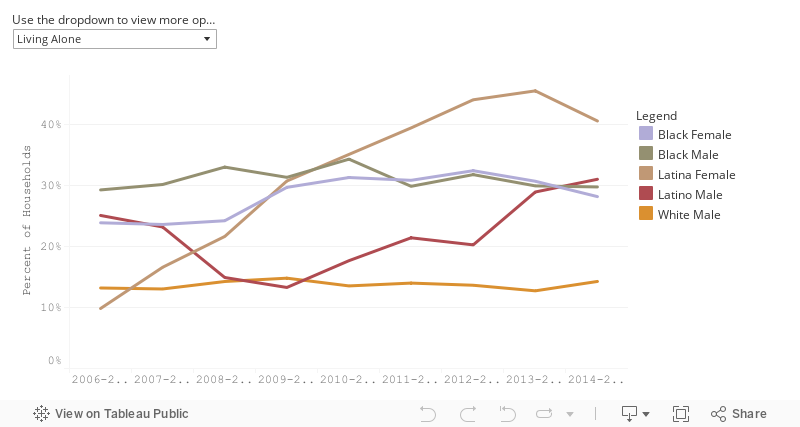
Those experiencing poverty tend to be clustered in groups instead of distributed evenly across a given geographic area. Concentrated poverty captures these clusters at a neighborhood level [2]. The following analyses define concentrated poverty as a neighborhood in which 40% or more of residents experience poverty. Residents living in areas of concentrated poverty may or may not be experiencing poverty themselves; regardless, they are relatively more likely to experience poverty in the future [3][4][5][6]. This effect is particularly pronounced for children; one study found that children were 50% more likely to have significantly less income than their parents when growing up in neighborhoods with high poverty rates [6].

Glossary terms used in this section: Margin of Error, Household, and Householder

Key Points

Adult females had consistently higher rates of poverty than adult males.

On average, from 2014-2018, an estimated 16% of adult females experienced poverty compared to about 13% of adult males. During the same time period, about 29% of female children and 26% of male children experienced poverty (these estimates for child poverty are within the margin of error).
From 2014-2018, adult Latina females were more than four times as likely as adult White males and more than three times as likely as adult White females to have experienced poverty.
More Black and Latina females consistently lived in areas of concentrated poverty compared to their White peers.
Regardless of sex, Black and Latinx residents had higher rates of poverty than White residents.
Residents in married households generally had the lowest poverty rates compared to residents in every other type of household composition.
From 2014-2018, about 18% of Black female adults lived in areas of concentrated poverty compared to 11% of Latina female adults and only 2% of White female adults.

While Latina and Black female children had similar rates of living in concentrated poverty areas (16% and 15%, respectively), these rates were much higher than those of White female children (1%).
Latina females consistently had the highest rates of adult poverty, followed by Latino males, Black females, and Black males.

White adult males and females consistently had the lowest rates of poverty.
Across most of the 5-year samples, residents living in households with male householders without a spouse had lower poverty rates than residents living in households with female householders without a spouse.
When comparing the poverty rates of residents living in households headed by married couples, female householders without a spouse, and females living alone, White residents had lower poverty rates than Black and Latinx residents in the same household type.

Historical Context

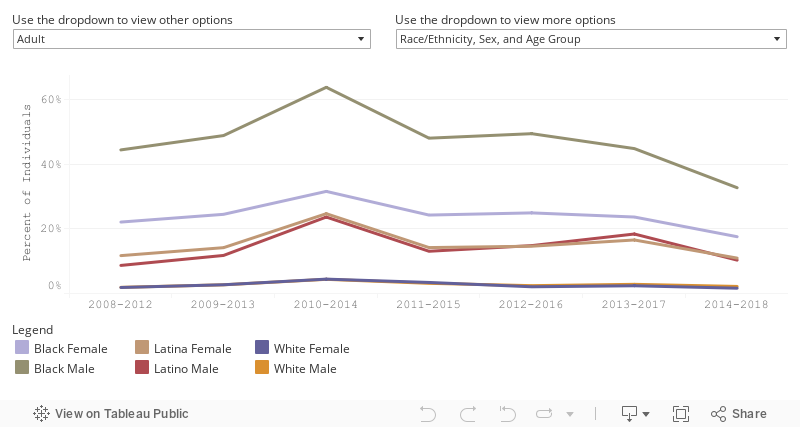
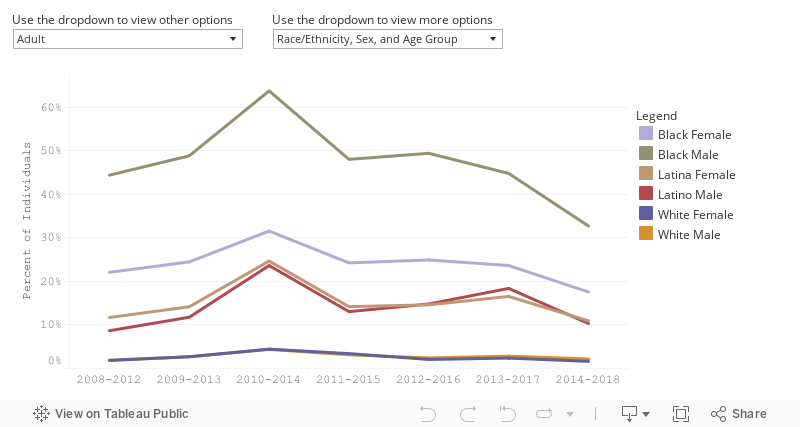
The national poverty rate for the United States was 12.4% in 1969 and 11.8% in 2018 [1][7]. While living conditions have improved over time, poverty rates have remained stable. Additionally, racial and ethnic differences in poverty (those living below the federal poverty threshold) and in concentrated poverty (neighborhoods with higher levels of poverty) have persisted [2]. These differences are rooted in various historical policies from Jim Crow segregation to the practice of redlining in which red lines were drawn primarily around non-White neighborhoods to show that the areas were high-risk for mortgage lenders and financial investment [8]. Even the physical construction of U.S. 52 that cuts through East Winston-Salem disproportionately uprooted Black residents, businesses, and therefore, employment opportunities [9]. Today, residents who live in areas of concentrated poverty are economically and racially segregated, and have less access to sufficiently-funded public education and other community resources such as family planning clinics and public libraries [10][11].  

On an individual level, poverty results in disadvantages that are far reaching. This is especially true for children who experience poverty early in life since they are also likely to experience adverse outcomes in adulthood, making social and economic mobility difficult [6][12][13]. Further, systemic racism affects social and economic mobility for Black and Latnix Americans even more as educational and employment opportunities, including racial biases in hiring practices, are limited [14][15][16].

Data Dashboards

Poverty Rates for Individuals

1-year Estimates

5-year Estimates

Key Points:

  • Adult females, compared to adult males, have consistently had higher rates of poverty; however, female and male children have been about the same. From 2014-2018, 16% of adult females were living in poverty compared to 13% of adult males.
  • Regardless of sex, Black and Latinx adults have higher rates of poverty than White adults in the 5-year data. Latina females consistently had the highest rates of adult poverty, followed by Latino males, Black females, and Black males. White adult males and females consistently had the lowest rates of poverty.
  • There were also significant differences in the poverty rates of Black and Latinx children and White children, but differences between the poverty rates of children by sex are generally within the margin of error.
  • From 2014-2018, adult Latina females were more than four times as likely as adult White males and more than three times as likely as adult White females to experience poverty.
  • Poverty rates were generally highest in 2012, and have decreased since then.

Data Notes:

  • The margins of error for Latinx adults and children by race/ethnicity in the 1-year sample were too high to use and were excluded from the visualization.
  • Some margins of error for Black adults in the 1-year sample are high. Analysts recommend using the 5-year sample for estimates about these residents.
  • In the 5-year sample, it appears that there are differences between the poverty rates of adult Black males and females after the 2010-2014 sample, however in the 2012-2016, 2013-2017, and 2014-2018 samples this difference is within the margin of error.
  • The most recent poverty data available is from 2018. Current poverty rates are likely to be higher as a result of COVID-19. For more resources on how COVID-19 may be impacting this measure, click here.
  • Source: U.S. Census Bureau American Community Survey (ACS) 1- and 5-year Public Use Microdata Samples
  • Adult females, compared to adult males, have consistently had higher rates of poverty; however, female and male children have been about the same. From 2014-2018, 16% of adult females were living in poverty compared to 13% of adult males.
  • Regardless of sex, Black and Latinx adults have higher rates of poverty than White adults in the 5-year data. Latina females consistently had the highest rates of adult poverty, followed by Latino males, Black females, and Black males. White adult males and females consistently had the lowest rates of poverty.
  • There were also significant differences in the poverty rates of Black and Latinx children and White children, but differences between the poverty rates of children by sex are generally within the margin of error.
  • From 2014-2018, adult Latina females were more than four times as likely as adult White males and more than three times as likely as adult White females to experience poverty.
  • Poverty rates were generally highest in 2012, and have decreased since then.
  • The margins of error for Latinx adults and children by race/ethnicity in the 1-year sample were too high to use and were excluded from the visualization.
  • Some margins of error for Black adults in the 1-year sample are high. Analysts recommend using the 5-year sample for estimates about these residents.
  • In the 5-year sample, it appears that there are differences between the poverty rates of adult Black males and females after the 2010-2014 sample, however in the 2012-2016, 2013-2017, and 2014-2018 samples this difference is within the margin of error.
  • The most recent poverty data available is from 2018. Current poverty rates are likely to be higher as a result of COVID-19. For more resources on how COVID-19 may be impacting this measure, click here.
  • Source: U.S. Census Bureau American Community Survey (ACS) 1- and 5-year Public Use Microdata Samples

Poverty Rates by Household Type

1-year Estimates

5-year Estimates

Key Points:

  • Residents in married households in Forsyth County generally have the lowest poverty rates compared to residents in every other household composition. On average from 2014-2018, about 9% of residents in married households experienced poverty compared to 20-21% of residents living alone, 29-35% of residents in households headed by non-married householders, and 34% of non-family (e.g. roommate/non-relative) households.
  • Across most of the 5-year samples, residents living in households with male householders without a spouse had lower poverty rates than residents living in households with female householders without a spouse, though from 2014-2018 this difference was within the margin of error.
  • When comparing the poverty rates of residents living in households headed by married couples, female householders without a spouse, and females living alone, White residents have lower poverty rates than Black and Latinx residents in the same household type.
  • Notably, from 2014-2018, an estimated 32% Latinx residents living in households headed by a married couple experienced poverty compared to 9% of Black residents and 4% of White residents living in households headed by married couples. 

Data Notes:

  • The 1-year data samples were too small to calculate household type by race/ethnicity.
  • In the 1-year data, the margins of error for male householders with no spouse present were too high to use, so that data was excluded.
  • In some 1-year samples, the following household types had high margins of error (analysts recommend using the 5-year sample as poverty rate estimates for these households): 
  • males living alone,
  • non-family households that were not living alone,
  • and some female householders without spouses.
  • The estimates by race/ethnicity, especially for non-married households, should be interpreted with caution given the high margins of error for some of the estimates; however, analysts are confident the disparities mentioned are outside of the margin of error.
  • The most recent poverty data available is from 2018. Current poverty rates are likely to be higher as a result of COVID-19. For more resources on how COVID-19 may be impacting this measure, click here.
  • Source: U.S. Census Bureau American Community Survey (ACS) 1- and 5-year Public Use Microdata Samples
  • Residents in married households in Forsyth County generally have the lowest poverty rates compared to residents in every other household composition. On average from 2014-2018, about 9% of residents in married households experienced poverty compared to 20-21% of residents living alone, 29-35% of residents in households headed by non-married householders, and 34% of non-family (e.g. roommate/non-relative) households.
  • Across most of the 5-year samples, residents living in households with male householders without a spouse had lower poverty rates than residents living in households with female householders without a spouse, though from 2014-2018 this difference was within the margin of error.
  • When comparing the poverty rates of residents living in households headed by married couples, female householders without a spouse, and females living alone, White residents have lower poverty rates than Black and Latinx residents in the same household type.
  • Notably, from 2014-2018, an estimated 32% Latinx residents living in households headed by a married couple experienced poverty compared to 9% of Black residents and 4% of White residents living in households headed by married couples. 
  • The 1-year data samples were too small to calculate household type by race/ethnicity.
  • In the 1-year data, the margins of error for male householders with no spouse present were too high to use, so that data was excluded.
  • In some 1-year samples, the following household types had high margins of error (analysts recommend using the 5-year sample as poverty rate estimates for these households): 
  • males living alone,
  • non-family households that were not living alone,
  • and some female householders without spouses.
  • The estimates by race/ethnicity, especially for non-married households, should be interpreted with caution given the high margins of error for some of the estimates; however, analysts are confident the disparities mentioned are outside of the margin of error.
  • The most recent poverty data available is from 2018. Current poverty rates are likely to be higher as a result of COVID-19. For more resources on how COVID-19 may be impacting this measure, click here.
  • Source: U.S. Census Bureau American Community Survey (ACS) 1- and 5-year Public Use Microdata Samples

Individuals Living in Areas of Concentrated Poverty

5-year Estimates

Key Points:

  • From 2014-2018, the concentrated poverty rate for children was 9% compared to 7% for adults. This represents a decrease from 2008-2012 when the concentrated poverty rate for female children was 11% and 10% for male children. There were no changes for adult males during the same time, but the rate did decrease slightly for adult females from 8% to 7%.
  • Black and Latina females consistently have much higher rates of concentrated poverty than their White peers. From 2014-2018, about 18% of Black female adults lived in concentrated poverty areas compared to 11% of Latina female adults and only 2% of White female adults. While Latina and Black female children had similar rates of living in areas of concentrated poverty (16% and 15%, respectively), these rates were much higher than those of White female children (1%).

Data Notes:

  • From 2014-2018, the concentrated poverty rate for children was 9% compared to 7% for adults. This represents a decrease from 2008-2012 when the concentrated poverty rate for female children was 11% and 10% for male children. There were no changes for adult males during the same time, but the rate did decrease slightly for adult females from 8% to 7%.
  • Black and Latina females consistently have much higher rates of concentrated poverty than their White peers. From 2014-2018, about 18% of Black female adults lived in concentrated poverty areas compared to 11% of Latina female adults and only 2% of White female adults. While Latina and Black female children had similar rates of living in areas of concentrated poverty (16% and 15%, respectively), these rates were much higher than those of White female children (1%).

Median Income

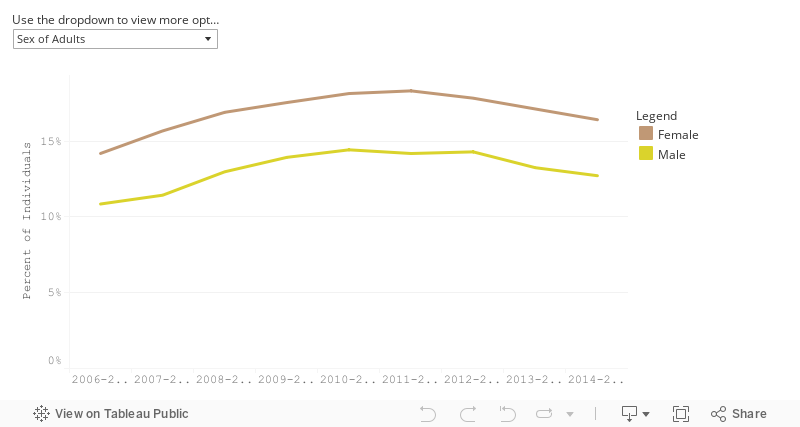
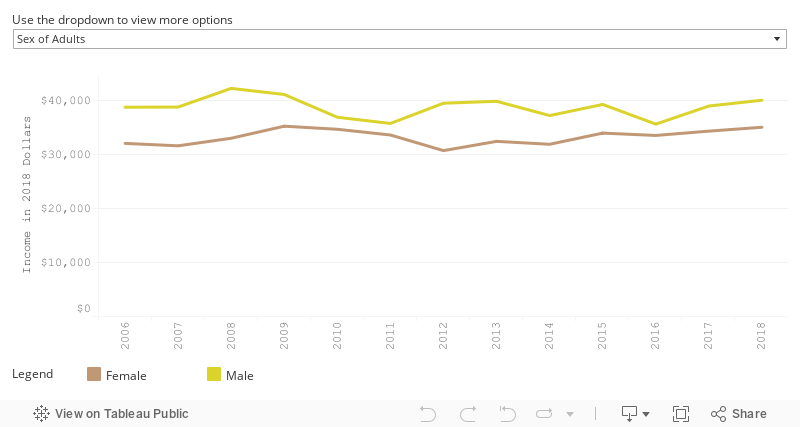
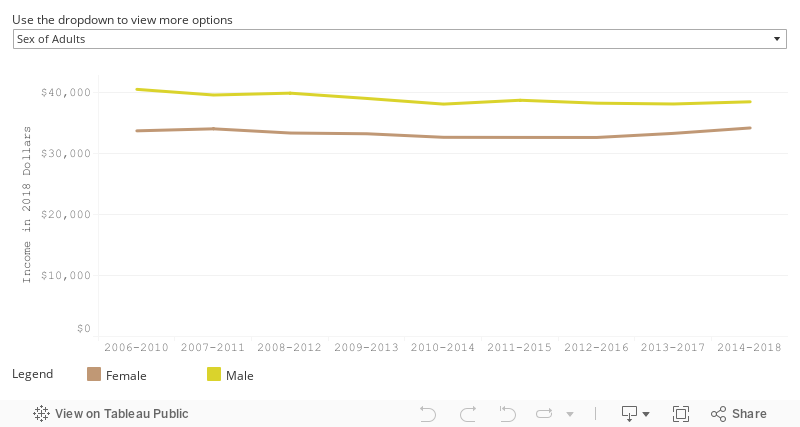
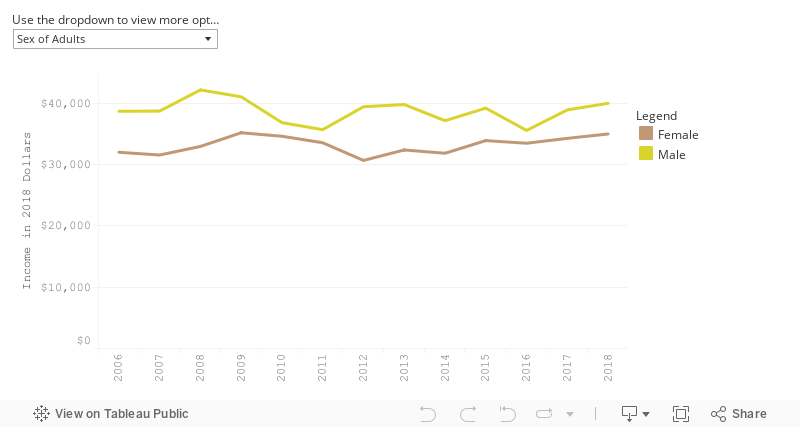
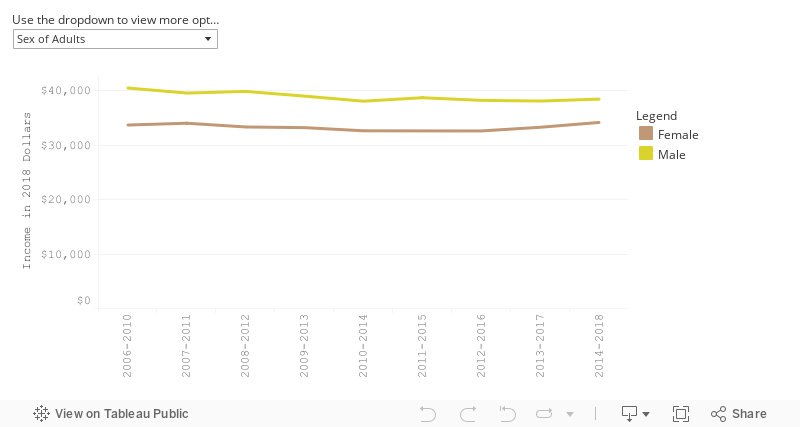
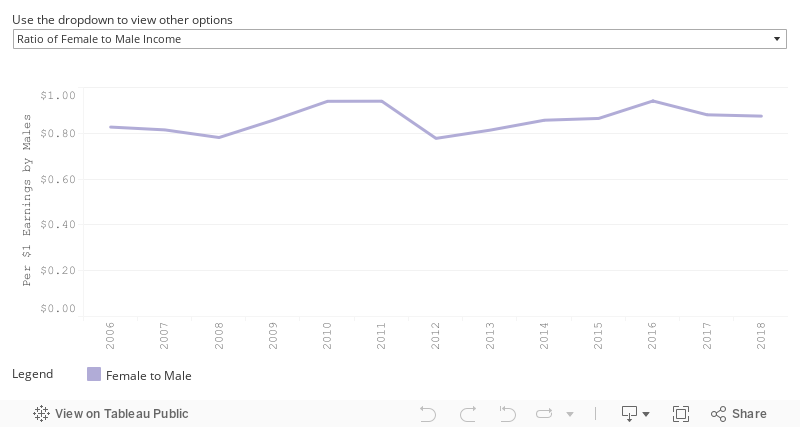
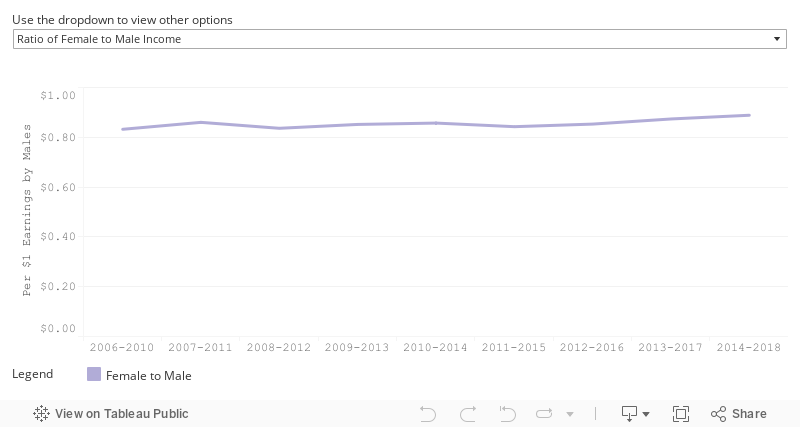
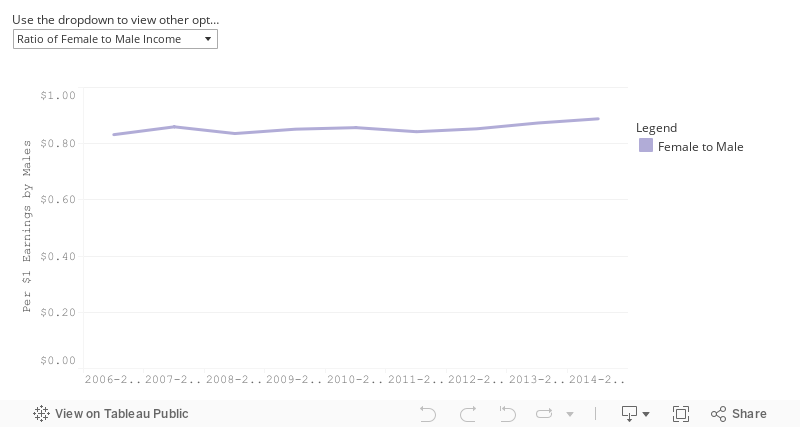
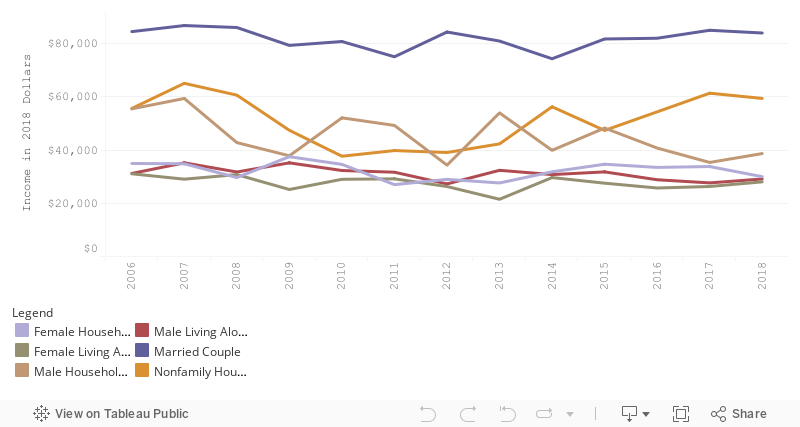
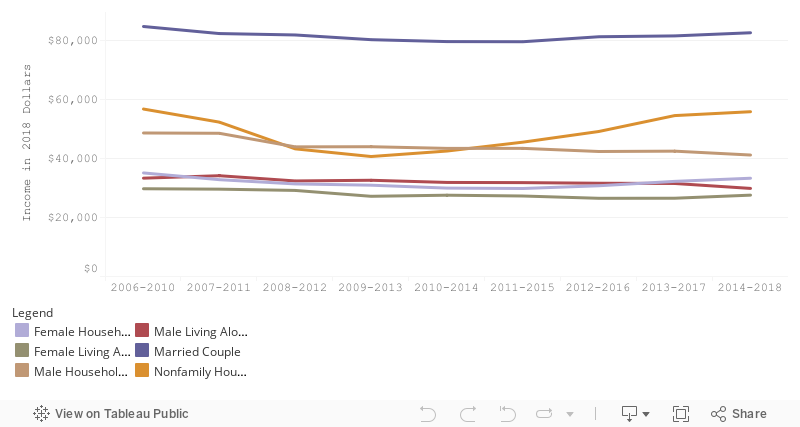
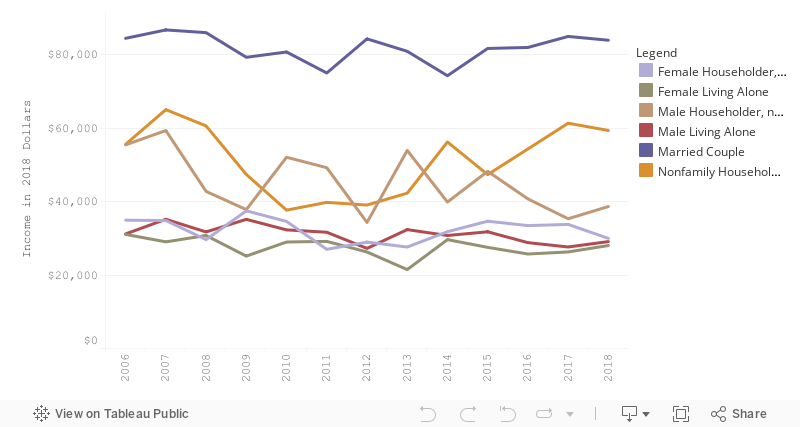
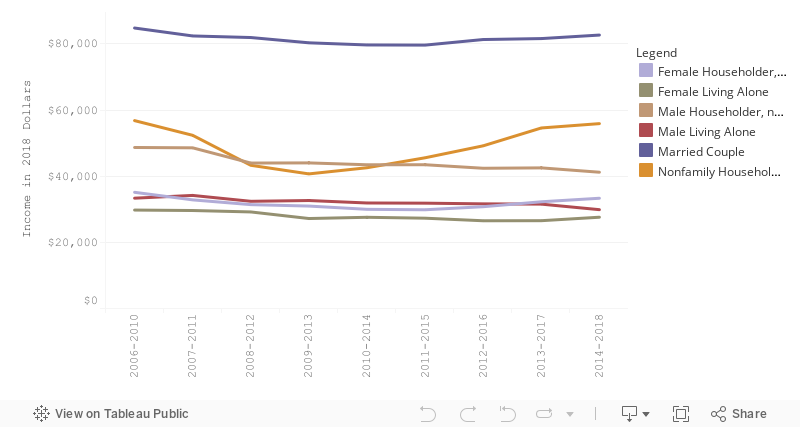
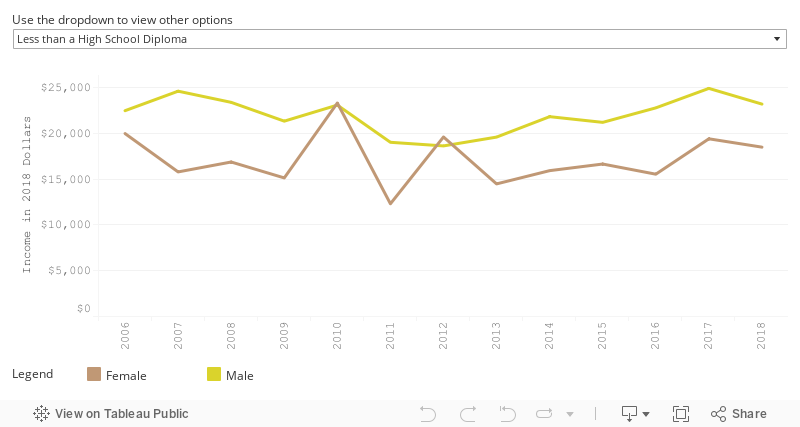
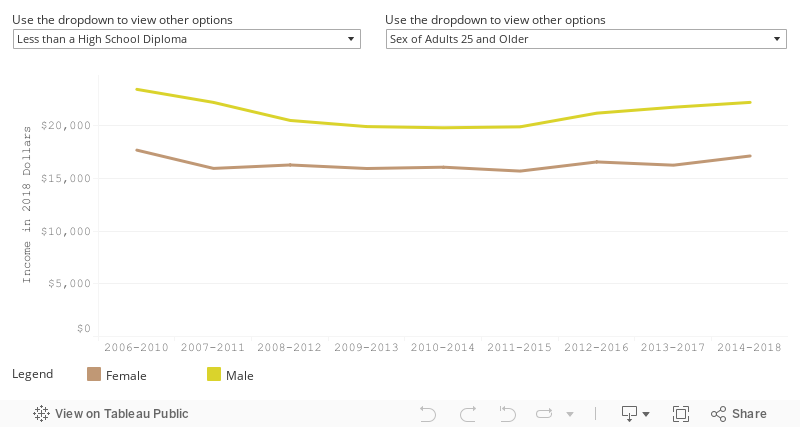
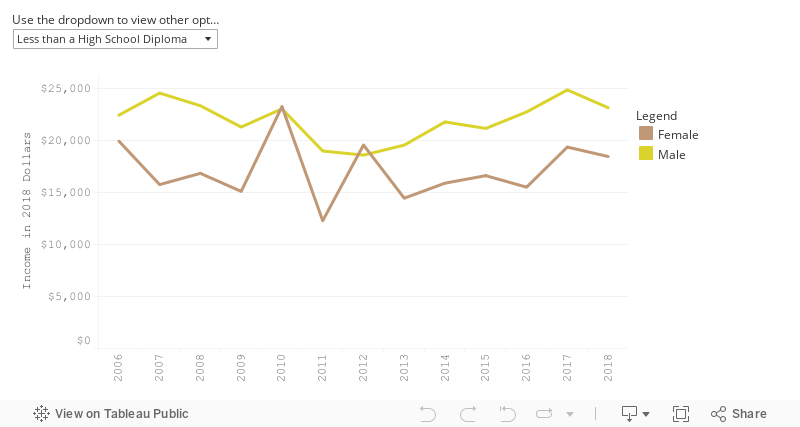
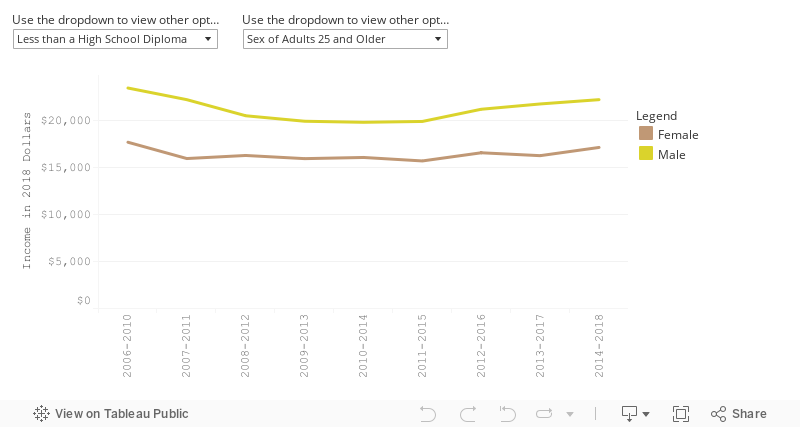
Access to financial resources is critical to financial security. A group’s median income can indicate how that group’s income has changed over time and how it compares to other groups. Median income describes the level of income that half a group is above and the other half is below. For example, from 2014-2018, the median income for adult females working full time was $34,148. This means that half of adult females in Forsyth County earned less than $34,148 and half earned more.

Glossary terms used in this section: Median, Full-Time Work, Disparity, Household, Household Type, Householder

Key Points

From 2014-2018, the median income for adult females working full time was 89% of that of adult males, with females earning a median of about $34,148 dollars and males earning a median of $38,342.
Married-couple households generally have the highest median income of any household type, followed by non-family households (residents who share a home with people they are not related to, e.g. roommates).
The median income for White females from 2014-2018 was 82% of the median income for White males, but the median income of Black and Latina females was 60% and 44% of the median income for White males, respectively.
From 2014-2018, married-couple households had about twice the median income of households with male or female householders living alone or without spouses.

According to the Census classification of household types, households with unmarried householders include multiple residents (e.g. children) and householders living alone do not; having a lower median income could make it particularly difficult for these households to be economically secure.
As the level of education increases, the disparity between male and female median incomes generally increase as well.

For example, males with a high school diploma or GED as their highest level of education have a median income $10,000 more than that of females with the same level of education (~$35k vs ~$25k, respectively), but males with more than a bachelor’s degree as their highest level of education have a median income that is almost twice that of females with the same level of education (~$100k vs ~55k, respectively).

Data Dashboards

Median Income of Full-time Workers

1-year Estimates

5-year Estimates

Key Points:

  • The median income for full-time workers has been consistently higher for males compared to females in the 5-year estimates. For example, from 2014-2018, males’ average median income was $38,342 compared to about $34,148 for females. In the 1-year estimates we see that males had a median income of $40,000 in 2018 compared to $35,000 for females.
  • There are significant racial disparities in median income. In the 5-year estimates, White males have disproportionately higher median incomes compared to other racial/ethnic and gender groups. For example, from 2014-2018, the average median income for White males was about $48,180; this was about $8,818 more than White females, $18,465 more than Black females, $19,247 more than Black males, $24,356 more than Hispanic/Latino males and about $27,098 more than Hispanic/Latina females, over the same period. Additionally, while income levels for White females are lower than those for White males, they have significantly higher median incomes compared to both Black males and females and Latinx males and females across the 5-year estimates.

Data Notes:

  • Residents under the age of 18 and residents working fewer than 30 hours per week have been excluded from this analysis.
  • All dollar amounts are expressed in 2018 dollars to control for inflation.
  • Margins of error for Latinx adults in the 1-year data were too high to use and were excluded. Some remaining margins of error for sex and race/ethnicity together in the 1-year data have high margins of error and should be interpreted with caution.
  • The most recent income data available is from 2018. Current income data may change as a result of COVID-19. For more resources on how COVID-19 may be impacting this measure, click here.
  • Source: U.S. Census Bureau American Community Survey (ACS) 1- and 5-year Public Use Microdata Samples
  • The median income for full-time workers has been consistently higher for males compared to females in the 5-year estimates. For example, from 2014-2018, males’ average median income was $38,342 compared to about $34,148 for females. In the 1-year estimates we see that males had a median income of $40,000 in 2018 compared to $35,000 for females.
  • There are significant racial disparities in median income. In the 5-year estimates, White males have disproportionately higher median incomes compared to other racial/ethnic and gender groups. For example, from 2014-2018, the average median income for White males was about $48,180; this was about $8,818 more than White females, $18,465 more than Black females, $19,247 more than Black males, $24,356 more than Hispanic/Latino males and about $27,098 more than Hispanic/Latina females, over the same period. Additionally, while income levels for White females are lower than those for White males, they have significantly higher median incomes compared to both Black males and females and Latinx males and females across the 5-year estimates.
  • Residents under the age of 18 and residents working fewer than 30 hours per week have been excluded from this analysis.
  • All dollar amounts are expressed in 2018 dollars to control for inflation.
  • Margins of error for Latinx adults in the 1-year data were too high to use and were excluded. Some remaining margins of error for sex and race/ethnicity together in the 1-year data have high margins of error and should be interpreted with caution.
  • The most recent income data available is from 2018. Current income data may change as a result of COVID-19. For more resources on how COVID-19 may be impacting this measure, click here.
  • Source: U.S. Census Bureau American Community Survey (ACS) 1- and 5-year Public Use Microdata Samples

Wage Gap Ratios

1-year Estimates

5-year Estimates

Key Points:

  • The median income of women from 2014-2018 was 89% of that of men.
  • There are racial and ethnic disparities in average wages in both 5-year and 1-year data, using White males as the reference group because they have the highest median income. Among all racial/ethnic and gender groups, White females were the closest in the wage gap to their male counterparts at 82% from 2014-2018. Black males and females earned approximately 62% and 60%, respectively, of the median income of White males, while Latinx males and females earned approximately 49% and 44%, respectively, of the median income of White males in the same period.
  • The wage gap reduced the most for Latina females (from 37% to 44%) from 2006-2010 to 2014-2018. While some progress has been made toward pay equality with White males, the wage gap remains stark for Black and Latinx males and females.

Data Notes:

  • This analysis excludes residents working fewer than 30 hours per week and those who are younger than 18 years old.
  • Margins of error for Latina females in the 1-year sample were too high; this data was excluded. Data by race/ethnicity and sex in the 1-year sample sometimes had high margins of error and should be interpreted with caution.
  • While it appears the earnings of females relative to male earnings increased over time, the female-to-male ratio was not statistically significant across the sample years in the 5-year data trends.
  • The most recent poverty data available is from 2018. Current poverty rates are likely to be higher as a result of COVID-19. For more resources on how COVID-19 may be impacting this measure, click here.
  • Source: U.S. Census Bureau American Community Survey (ACS) 1- and 5-year Public Use Microdata Samples
  • The median income of women from 2014-2018 was 89% of that of men.
  • There are racial and ethnic disparities in average wages in both 5-year and 1-year data, using White males as the reference group because they have the highest median income. Among all racial/ethnic and gender groups, White females were the closest in the wage gap to their male counterparts at 82% from 2014-2018. Black males and females earned approximately 62% and 60%, respectively, of the median income of White males, while Latinx males and females earned approximately 49% and 44%, respectively, of the median income of White males in the same period.
  • The wage gap reduced the most for Latina females (from 37% to 44%) from 2006-2010 to 2014-2018. While some progress has been made toward pay equality with White males, the wage gap remains stark for Black and Latinx males and females.
  • This analysis excludes residents working fewer than 30 hours per week and those who are younger than 18 years old.
  • Margins of error for Latina females in the 1-year sample were too high; this data was excluded. Data by race/ethnicity and sex in the 1-year sample sometimes had high margins of error and should be interpreted with caution.
  • While it appears the earnings of females relative to male earnings increased over time, the female-to-male ratio was not statistically significant across the sample years in the 5-year data trends.
  • The most recent poverty data available is from 2018. Current poverty rates are likely to be higher as a result of COVID-19. For more resources on how COVID-19 may be impacting this measure, click here.
  • Source: U.S. Census Bureau American Community Survey (ACS) 1- and 5-year Public Use Microdata Samples

Median Income by Household Type

1-year Estimates

5-year Estimates

Key Points:

  • In the 5-year data, married couples in Forsyth County had higher median household incomes than any other type of household. Non-family households who share their home with people to whom they are not related (e.g., roommates) had the second-highest household incomes among all other household types.
  • From 2014-2018, married couple households had about twice the income of households with male or female householders living alone or without spouses.
  • From 2009-2013, non-family households had an average household income of about $40,686 which significantly increased to about $55,880 from 2014-2018.
  • The 1-year estimates of median household income by household type fluctuate over time. For example, non-family households reported their lowest median income in 2010 at about $37,690, which then increased to $59,409 in 2018. In the 5-year data, married couples consistently reported higher incomes each year since 2006 than any other household composition.

Data Notes:

  • In the 5-year data, married couples in Forsyth County had higher median household incomes than any other type of household. Non-family households who share their home with people to whom they are not related (e.g., roommates) had the second-highest household incomes among all other household types.
  • From 2014-2018, married couple households had about twice the income of households with male or female householders living alone or without spouses.
  • From 2009-2013, non-family households had an average household income of about $40,686 which significantly increased to about $55,880 from 2014-2018.
  • The 1-year estimates of median household income by household type fluctuate over time. For example, non-family households reported their lowest median income in 2010 at about $37,690, which then increased to $59,409 in 2018. In the 5-year data, married couples consistently reported higher incomes each year since 2006 than any other household composition.

Median Income of Individuals by Education Attainment

1-year Estimates

5-year Estimates

Key Points:

  • At all education levels higher than less than a high school diploma, females had a lower median income than males in 2018. The disparity between females and males was highest for those who had more than a bachelor’s degree. Below are the median incomes for males and females in 2018 by education level:
  • High School Diploma or GED: females ($25k), males ($35k)
  • Some College or Associate’s: females ($33k), males ($41k)
  • Bachelor’s Degree: females ($45k), males ($60k)
  • More than a Bachelor’s: females ($55k), males ($100k)
  • Median incomes by education for females have stayed stable since 2006.
  • When looking at the median incomes of females by level of education and race/ethnicity:
  • White females with bachelor’s degrees and some college as their highest level of education consistently have higher median incomes than Black females with the same level of education.
  • White females with high school diplomas have higher median incomes than both Black and Latina females with the same level of education.
  • There are not consistent, significant differences in median income among females by race/ethnicity for females with less than a high school diploma or more than a bachelor’s degree.

Data Notes:

  • Margins of error for analyses by race/ethnicity in the 1-year sample were too large to use. This data has been omitted.
  • Margins of error for median incomes by sex, race/ethnicity, and education level together tend to be very high and should be interpreted with caution.
  • Data for residents under the age of 25 is excluded from this analysis.
  • All dollar amounts are expressed in 2018 dollars to control for inflation.
  • The most recent income data available is from 2018. Current income data may change as a result of COVID-19. For more resources on how COVID-19 may be impacting this measure, click here.
  • Source: U.S. Census Bureau American Community Survey (ACS) 1- and 5-year Public Use Microdata Samples
  • At all education levels higher than less than a high school diploma, females had a lower median income than males in 2018. The disparity between females and males was highest for those who had more than a bachelor’s degree. Below are the median incomes for males and females in 2018 by education level:
  • High School Diploma or GED: females ($25k), males ($35k)
  • Some College or Associate’s: females ($33k), males ($41k)
  • Bachelor’s Degree: females ($45k), males ($60k)
  • More than a Bachelor’s: females ($55k), males ($100k)
  • Median incomes by education for females have stayed stable since 2006.
  • When looking at the median incomes of females by level of education and race/ethnicity:
  • White females with bachelor’s degrees and some college as their highest level of education consistently have higher median incomes than Black females with the same level of education.
  • White females with high school diplomas have higher median incomes than both Black and Latina females with the same level of education.
  • There are not consistent, significant differences in median income among females by race/ethnicity for females with less than a high school diploma or more than a bachelor’s degree.
  • Margins of error for analyses by race/ethnicity in the 1-year sample were too large to use. This data has been omitted.
  • Margins of error for median incomes by sex, race/ethnicity, and education level together tend to be very high and should be interpreted with caution.
  • Data for residents under the age of 25 is excluded from this analysis.
  • All dollar amounts are expressed in 2018 dollars to control for inflation.
  • The most recent income data available is from 2018. Current income data may change as a result of COVID-19. For more resources on how COVID-19 may be impacting this measure, click here.
  • Source: U.S. Census Bureau American Community Survey (ACS) 1- and 5-year Public Use Microdata Samples

Income Insufficiency

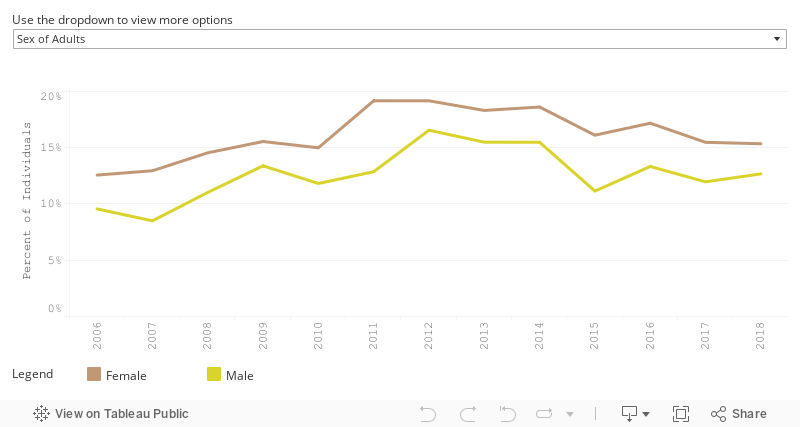
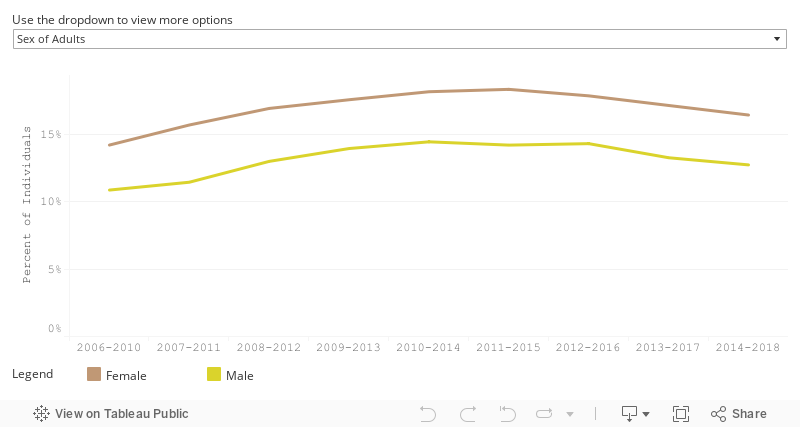
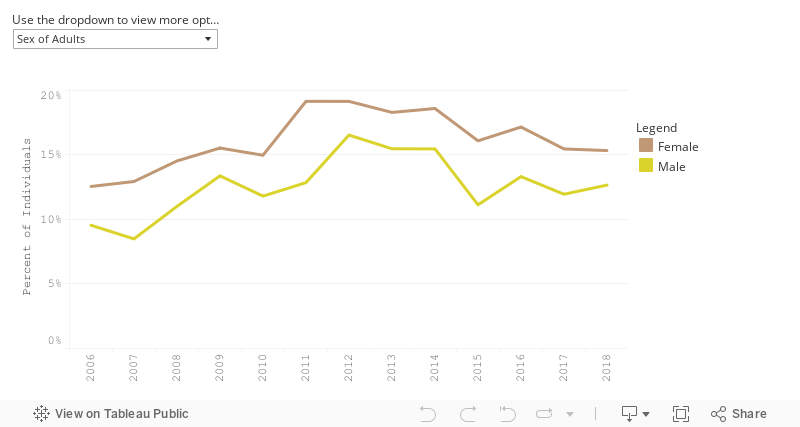
While poverty is an important economic indicator for a community, there is some evidence that poverty rates rely on outdated assumptions and do not take into account household expenses such as health or childcare costs [17]. Alternatively, the concept of income insufficiency describes those who earn less than their estimated essential expenses, including childcare, food, housing, transportation, healthcare, health insurance, other expenses (such as clothing, household cleaning products, and taxes, etc.). 

Forsyth Futures developed a local income insufficiency calculation to address shortcomings associated with poverty measures. This calculation represents a more detailed consideration of family expenses and circumstances. This measure was informed by similar analyses in the Self-Sufficiency Standard created by the Center for Women’s Welfare at the University of Washington for the United Way and the Living Wage Calculator developed by Dr. Amy Glasmeier at the Massachusetts Institute of Technology (MIT). In Forsyth Futures’ income insufficiency analyses, each household is broken down into economic units. The primary economic unit represents a reference person and all people related to them, their spouse or partner, and any non-related children. Households that are composed of unrelated individuals such as roommates are assigned to their own individual economic units. Expenses are then calculated at either at an individual level and summarized at the economic unit or they are calculated by the size of economic units. Tax groups are identified and broken down into one or more tax groups depending on the composition of the economic unit where taxes on income are calculated. Then all expenses are summarized for all economic units and compared their income to determine income insufficiency. Thus, income insufficiency estimates are based on average expenses across all households and do not account for actual annual required estimates. It is possible that expenses estimated are greater for some families and less for others. For example, healthcare expenses can vary drastically for a family that needs specialized and consistent medical care versus a family that sparingly accesses the healthcare system. For more information or any questions on the methodology of income insufficiency please email info@forsythfutures.org.

Glossary terms used in this section: Income Insufficiency

Key Points

Children have higher income insufficiency rates than adults. About 50% of female children live in households with insufficient incomes, compared to about 33% percent of adult females.
Black and Latinx adults and children have higher rates of income insufficiency than White adults and children. The income insufficiency rates of Black and Latinx adults and children are generally at least twice those of White adults and children. 

Data Dashboard

Income Insufficiency Rates of Individuals

1-year Estimates

Key Points:

  • In 2018, 34% of residents in Forsyth County were income insufficient.
  • Children have higher income insufficiency rates than adults. About 50% of female children lived in households with insufficient incomes, compared to about 33% percent of adult females.
  • Black and Latinx adults and children had higher rates of income insufficiency than White adults and children. The income insufficiency rates of Black and Latinx adults and children were generally at least twice those of White adults and children.

Data Notes:

  • Income insufficiency represents those who earn less than their estimated expenses. Estimates are based on average expenses across all individuals’ households and therefore, do not account for their actual required estimates.
  • Differences in the income insufficiency rates of males and females within the same age group are within the margin of error. 
  • Income insufficiency rates by race/ethnicity, sex, and age group have high margins of error. Specific estimates should be used with caution, and some apparent differences between groups are within the margin of error. The difference between White children and adults and their Black and Latinx counterparts is outside of the margin of error. 
  • The most recent income data available is from 2018. Current income data may change as a result of COVID-19. For more resources on how COVID-19 may be impacting this measure, click here.
  • Income Data Source:U.S. Census Bureau American Community Survey (ACS) 1- and 5-year Public Use Microdata Samples
  • Expense Data Sources are Listed on the Forsyth Futures Income Insufficiency Page
  • In 2018, 34% of residents in Forsyth County were income insufficient.
  • Children have higher income insufficiency rates than adults. About 50% of female children lived in households with insufficient incomes, compared to about 33% percent of adult females.
  • Black and Latinx adults and children had higher rates of income insufficiency than White adults and children. The income insufficiency rates of Black and Latinx adults and children were generally at least twice those of White adults and children.
  • Income insufficiency represents those who earn less than their estimated expenses. Estimates are based on average expenses across all individuals’ households and therefore, do not account for their actual required estimates.
  • Differences in the income insufficiency rates of males and females within the same age group are within the margin of error. 
  • Income insufficiency rates by race/ethnicity, sex, and age group have high margins of error. Specific estimates should be used with caution, and some apparent differences between groups are within the margin of error. The difference between White children and adults and their Black and Latinx counterparts is outside of the margin of error. 
  • The most recent income data available is from 2018. Current income data may change as a result of COVID-19. For more resources on how COVID-19 may be impacting this measure, click here.
  • Income Data Source:U.S. Census Bureau American Community Survey (ACS) 1- and 5-year Public Use Microdata Samples
  • Expense Data Sources are Listed on the Forsyth Futures Income Insufficiency Page

Supports for Low-Income Families

Several federal and state programs exist to help fill the gaps between low-income households’ cost of living and income. However, many residents who need such support may not meet the income or other requirements for these programs. Additionally, as residents increase their income, they may abruptly lose access to these supports once they no longer meet the income qualifications. If residents lose more supports than they gained in income, this increase in income could end up being financially detrimental, in a phenomenon known as the benefits cliff [18]. The table below lists some of the federal and state programs available and the income requirements for participation.

Supports for Low-Income Families

Tabular Data

Average Federal Income Tax Credit for a Forsyth County Tax Filer
Thresholds for Work Supports for a Three-Person Family in Forsyth County

Based on the 2019 federal poverty level annual income of $21,330 for a three-person family with one child
Work Support
Income Threshold
% of Poverty
Federal Earned Income Tax Credit
--
--
Single, Head of Household, or Widowed
$41,094
Married Filing Jointly
$46,884
193%
220%
Child Care Subsidy
NC Health Choice (SCHIP-Children's Health Insurance)
188%
$40,176
$36,384
Section 8 Housing
171%
$27,900
131%
Supplemental Nutrition Assistance Program
$27,732-$42,672
Work First (Temporary Aid for Needy Families)
130-200%
$6,528
31%
Forsyth County Housing & Community Development Home Ownership Program
$44,550
209%

Data Notes:

Average Federal Income Tax Credit for a Forsyth County Tax Filer
Brookings Institution. (2016, December 21). Earned Income Tax Credit (EITC) interactive and resources. Retrieved from https://www.brookings.edu/interactives/earned-income-tax-credit-eitc-interactive-and-resources/
2019 Federal Poverty Annual Income for Three-Person Family
U.S. Department of Health and Human Services. (n.d.). 2019 Poverty Guidelines. Retrieved from https://aspe.hhs.gov/2019-poverty-guidelines
Federal Earned Income Tax Credit
Internal Revenue Service. (2020, August 27). Earned Income Tax Credit Income Limits and Maximum Credit Amounts. Retrieved from https://www.irs.gov/credits-deductions/individuals/earned-income-tax-credit/earned-income-tax-credit-income-limits-and-maximum-credit-amounts
Childcare Subsidy
Forsyth County Government Center. (n.d.). Child Day Care. Retrieved September 13, 2020, from https://www.forsyth.cc/DSS/TEAM_daycare.aspx.
NC Health Choice (SCHIP-Children’s Health Insurance)
NC Medicaid Division of Health Benefits. (n.d.). Health Choice Income and Resources Requirements. Retrieved September 13, 2020, from https://medicaid.ncdhhs.gov/beneficiaries/get-started/eligibility-medicaid-or-health-choice/health-choice-income-and-resources
Section 8 Housing and Development Home Ownership Program
HUD’s Office of Policy Development and Research. (n.d.). Income Limits. Retrieved from https://www.huduser.gov/portal/datasets/il.html#2019
Supplemental Nutrition Assistance Program
NC Department of Health and Human Services. (n.d.). Food and Nutrition Services (Food Stamps). Retrieved September 13, 2020, from https://www.ncdhhs.gov/assistance/low-income-services/food-nutrition-services-food-stamps
Work First (Temporary Aid for Needy Families)
NC Department of Health and Human Services. (n.d.). Work First Eligibility and Income Requirements. Retrieved September 13, 2020, from https://www.ncdhhs.gov/divisions/social-services/work-first-family-assistance/work-first-eligibility-and-income
Average Federal Income Tax Credit for a Forsyth County Tax Filer
$2,510.00 (2014)
Thresholds for Work Supports for a Three-Person Family in Forsyth County
Based on the 2019 federal poverty level annual income of $21,330 for a three-person family with one child
Work Support
Income Threshold
% of Poverty
Federal Earned Income Tax Credit
--
--
Single, Head of Household, or Widowed
$41,094
Married Filing Jointly
$46,884
193%
220%
Child Care Subsidy
NC Health Choice (SCHIP-Children's Health Insurance)
188%
$40,176
$36,384
Section 8 Housing
171%
$27,900
131%
Supplemental Nutrition Assistance Program
$27,732-$42,672
Work First (Temporary Aid for Needy Families)
130-200%
$6,528
31%
Forsyth County Housing & Community Development Home Ownership Program
$44,550
209%
    Average Federal Income Tax Credit for a Forsyth County Tax Filer
    Brookings Institution. (2016, December 21). Earned Income Tax Credit (EITC) interactive and resources. Retrieved from https://www.brookings.edu/interactives/earned-income-tax-credit-eitc-interactive-and-resources/
    2019 Federal Poverty Annual Income for Three-Person Family
    U.S. Department of Health and Human Services. (n.d.). 2019 Poverty Guidelines. Retrieved from https://aspe.hhs.gov/2019-poverty-guidelines
    Federal Earned Income Tax Credit
    Internal Revenue Service. (2020, August 27). Earned Income Tax Credit Income Limits and Maximum Credit Amounts. Retrieved from https://www.irs.gov/credits-deductions/individuals/earned-income-tax-credit/earned-income-tax-credit-income-limits-and-maximum-credit-amounts
    Childcare Subsidy
    Forsyth County Government Center. (n.d.). Child Day Care. Retrieved September 13, 2020, from https://www.forsyth.cc/DSS/TEAM_daycare.aspx.
    NC Health Choice (SCHIP-Children’s Health Insurance)
    NC Medicaid Division of Health Benefits. (n.d.). Health Choice Income and Resources Requirements. Retrieved September 13, 2020, from https://medicaid.ncdhhs.gov/beneficiaries/get-started/eligibility-medicaid-or-health-choice/health-choice-income-and-resources
    Section 8 Housing and Development Home Ownership Program
    HUD’s Office of Policy Development and Research. (n.d.). Income Limits. Retrieved from https://www.huduser.gov/portal/datasets/il.html#2019
    Supplemental Nutrition Assistance Program
    NC Department of Health and Human Services. (n.d.). Food and Nutrition Services (Food Stamps). Retrieved September 13, 2020, from https://www.ncdhhs.gov/assistance/low-income-services/food-nutrition-services-food-stamps
    Work First (Temporary Aid for Needy Families)
    NC Department of Health and Human Services. (n.d.). Work First Eligibility and Income Requirements. Retrieved September 13, 2020, from https://www.ncdhhs.gov/divisions/social-services/work-first-family-assistance/work-first-eligibility-and-income

    Healthcare Coverage

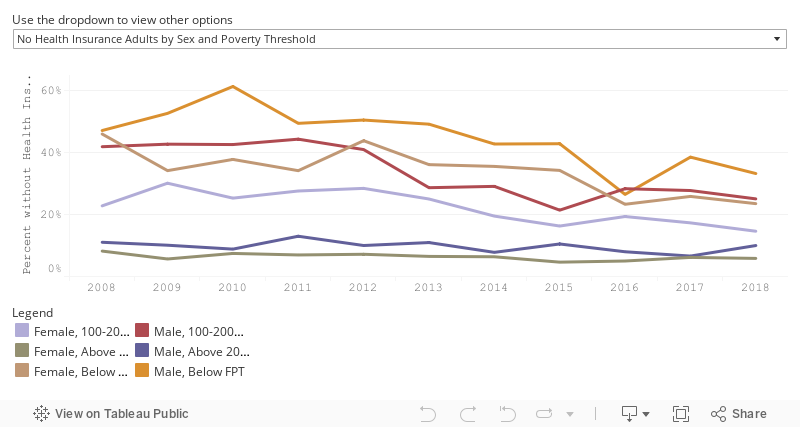
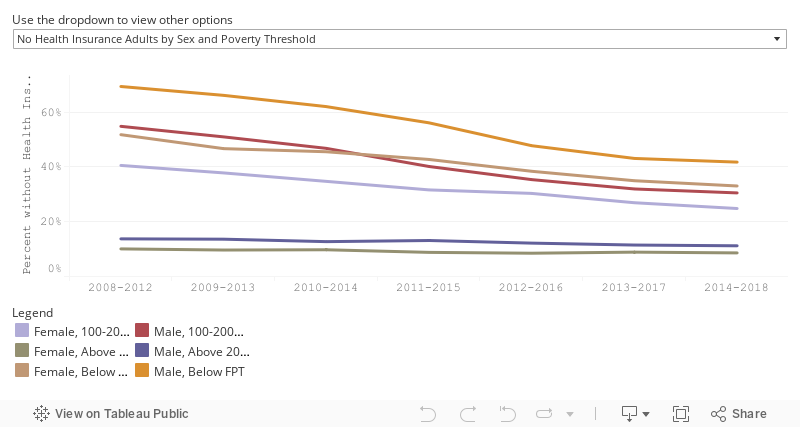
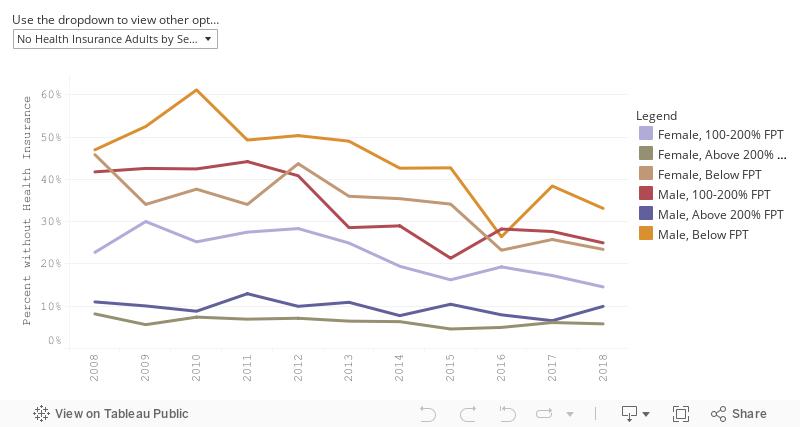
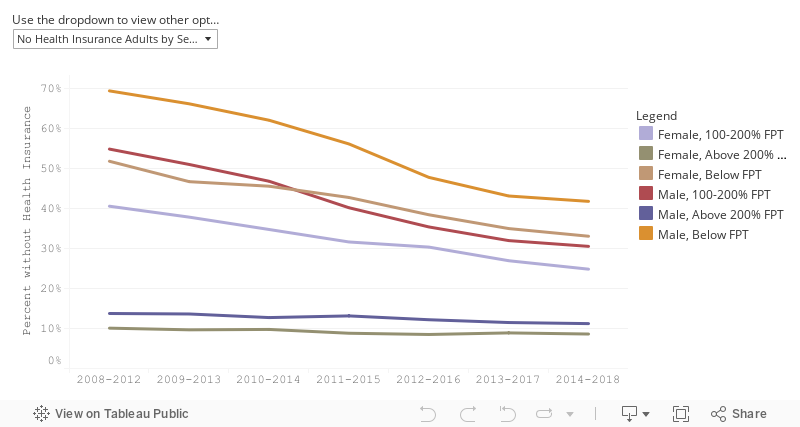
    Health insurance is crucial to economic stability. Healthcare costs are high and the United States spends more on healthcare than any other high-income country [19]. In addition to the associated health benefits of having health insurance, coverage also helps reduce the financial strain on individuals, families, and communities [20]. People without health insurance face more out-of-pocket expenses if they do utilize the healthcare system and can have negative health outcomes if they do not access healthcare when they are sick, which then can affect their economic security (e.g., having to miss work). Lack of health insurance also affects the broader healthcare system as hospitals and other healthcare networks provide uncompensated labor to meet health needs which can affect their allocation of resources [20].

    Key Points

    23% of adult females below the Federal Poverty Threshold do not have health insurance compared to about 6% of adult females above 200% of the Federal Poverty Threshold.
    Adult Latina females and females below the poverty thresholds had relatively high rates of not being insured.

    In 2018, an estimated 43% of adult Latina females did not have health insurance, compared to 8% and 6% of Black and White adult females respectively.
    Adult females were more likely to have healthcare coverage than adult men.
    Not having healthcare coverage could put residents at a higher risk of financial challenges if they experience unexpected healthcare costs.

    Females who are already experiencing poverty or are at a greater risk of poverty are less likely than other females to have health insurance coverage.

    Historical Context

    Nearly 18% of North Carolinians are covered by Medicaid [21]. The passing of The Affordable Care Act (ACA) and the subsequent Supreme Court ruling gave states the option to expand Medicaid eligibility requirements. Such expansion provides more coverage to low-income individuals without employer-based health insurance or affordable access. North Carolina is in the minority of states that has still not expanded their Medicaid eligibility requirements [21]. An estimated 194,000 uninsured adults below the federal poverty threshold would be eligible if Medicaid were expanded [22]. 

    The disparities in healthcare coverage between Latinx populations and non-Latinx populations are due to a variety of both economic and non-economic factors. Employer-based health insurance is the most common form of health insurance for working-age adults and Latinx populations are less likely to receive that benefit from an employer compared to White populations [23]. Additionally, immigration status affects one’s ability to qualify for Medicaid and North Carolina Health Choice (CHIP). Often immigrants that are ‘lawfully present’ must wait five years to become eligible for those programs. For example, Lawful Permanent Residents (LPR/Green Card Holders) must wait five years, although there are exceptions for “lawfully residing” children and/or pregnant women [24].

    Data Dashboard

    Rates of Individuals without Health Insurance

    1-year Estimates

    5-year Estimates

    Key Points:

    • Adult females had consistently lower rates of being uninsured than males, with 10% of females uninsured in 2018 compared to 15% of males.
    • Adult Latinx females (at 43% in 2018) had a significantly higher rate of being uninsured compared to 8% of Black adult females and 6% of White adult females that same year.
    • Adult females above 200% of the Federal Poverty Threshold were less likely to be uninsured than females below the threshold. In 2018, about 23% of adult females below this threshold were uninsured, compared to about 6% of adult females above 200% of the poverty threshold.
    • Rates of being uninsured have dropped significantly for adult females from 16% in 2008 to 10% in 2018, as well as for female children from 9% in 2008 to 3% in 2018.

    Data Notes:

    • There were too few children without health insurance in the 1-year samples to produce reliable estimates.
    • The margins of error for the percentage of children without health insurance by sex and race/ethnicity were too high to use, and were omitted.
    • The most recent income data available is from 2018. Current income data may change as a result of COVID-19. For more resources on how COVID-19 may be impacting this measure, click here.
    • Source: U.S. Census Bureau American Community Survey (ACS) 1- and 5-year Public Use Microdata Samples
    • Adult females had consistently lower rates of being uninsured than males, with 10% of females uninsured in 2018 compared to 15% of males.
    • Adult Latinx females (at 43% in 2018) had a significantly higher rate of being uninsured compared to 8% of Black adult females and 6% of White adult females that same year.
    • Adult females above 200% of the Federal Poverty Threshold were less likely to be uninsured than females below the threshold. In 2018, about 23% of adult females below this threshold were uninsured, compared to about 6% of adult females above 200% of the poverty threshold.
    • Rates of being uninsured have dropped significantly for adult females from 16% in 2008 to 10% in 2018, as well as for female children from 9% in 2008 to 3% in 2018.
    • There were too few children without health insurance in the 1-year samples to produce reliable estimates.
    • The margins of error for the percentage of children without health insurance by sex and race/ethnicity were too high to use, and were omitted.
    • The most recent income data available is from 2018. Current income data may change as a result of COVID-19. For more resources on how COVID-19 may be impacting this measure, click here.
    • Source: U.S. Census Bureau American Community Survey (ACS) 1- and 5-year Public Use Microdata Samples

    Teen Pregnancy

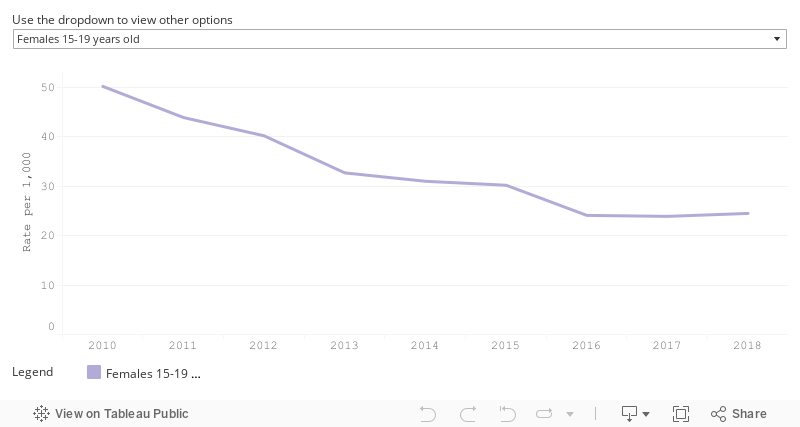
    Even compared to other single parents, having a first baby during one’s teenage years puts young women at particular risk of negative economic outcomes [25]. Teenage mothers are less likely to complete high school in adolescence [25][26] and they have higher poverty rates in adulthood than women who delay having children [25]. This measure looks at the rate of pregnancies among Forsyth County girls ages 15-19. Teen pregnancy rates represent the rate of pregnancy for females between the ages of 15 and 19 for any identified racial and/or ethnic group per 1,000 of that same racial/ethnic group in a given year.

    Key Points

    Teen pregnancy rates generally decreased since 2010, but Black and Latinx teens are still 3-4 times as likely as White teens to become pregnant.
    Experiencing teenage pregnancy can put girls at a higher risk of not finishing high school and experiencing poverty as an adult.

    Data Dashboard

    Teen Pregnancy Rates

    1-year Estimates

    Key Points:

    • Pregnancy rates for females between the ages of 15 and 19 significantly decreased from 2010-2018 for all racial and ethnic groups in Forsyth County.
    • The teen pregnancy rate varies from one racial and/or ethnic group to another in each year analyzed. Latina females consistently have the highest rate (about 49 per 1,000 births in 2018), followed by Black females (about 31 per 1,000 births in 2018), and White females with the lowest rate (about 11 per 1,000 births in 2018).

    Data Notes:

    • Pregnancy rates for females between the ages of 15 and 19 significantly decreased from 2010-2018 for all racial and ethnic groups in Forsyth County.
    • The teen pregnancy rate varies from one racial and/or ethnic group to another in each year analyzed. Latina females consistently have the highest rate (about 49 per 1,000 births in 2018), followed by Black females (about 31 per 1,000 births in 2018), and White females with the lowest rate (about 11 per 1,000 births in 2018).

    References

    1. Semega, J., Kollar, M, Creamer, J. & Mohanty, A. (2019, September 10). Income and poverty in the United States: 2018. United States Census Bureau. https://www.census.gov/library/publications/2019/demo/p60-266.html
    2. Iceland, J., & Hernandez, E. (2017). Understanding trends in concentrated poverty: 1980–2014. Social Science Research, 62, 75-95.
    3. Kneebone, E., Holmes, N. (2016, March 31). U.S. concentrated poverty in the wake of the great recession. The Brookings Institution. Retrieved from https://www.brookings.edu/research/u-s-concentrated-poverty-in-the-wake-of-the-great-recession
    4. Kneebone, E., Nadeau, C., & Berube, A. (2011). The re-emergence of concentrated poverty. The Brookings Institution. Retrieved from https://www.brookings.edu/research/the-re-emergence-of-concentrated-poverty-metropolitan-trends-in-the-2000s
    5. Rothwell, J. (2014, November 12). The Neighborhood effect: Localities and upward mobility. The Brookings Institution. Retrieved from https://www.brookings.edu/blog/social-mobility-memos/2014/11/12/the-neighborhood-effect-localities-and-upward-mobility
    6. Sharkey, P. (2009). Neighborhoods and the black-white mobility gap. Economic Mobility Project. Retrieved from http://www.pewtrusts.org/~/media/legacy/uploadedfiles/wwwpewtrustsorg/reports/economic_mobility/pewsharkeyv12pdf.pdf
    7. Hoynes, H. W., Page, M. E., & Stevens, A. H. (2006). Poverty in America: Trends and explanations. Journal of Economic Perspectives, 20(1), 47-68.
    8. Wilson, W. J. (2008). The political and economic forces shaping concentrated poverty. Political Science Quarterly, 123(4), 555-571.
    9. Fuller, A. (2012, December 13). 'Scorched earth' Razing of Belews Street community one of many urban-renewal projects. Winston-Salem Journal. https://journalnow.com/archives/scorched-earth-razing-of-belews-street-community-one-of-many-urban-renewal-projects/article_49fa00b6-e2c4-5742-8a31-3bbf5b6c1d81.html
    10. Lin, A. C., & Harris, D. R. (2009). The colors of poverty: Why racial & ethnic disparities persist. The National Poverty Center. Policy Brief, 16. http://www.npc.umich.edu/publications/policy_briefs/brief16/PolicyBrief16.pdf.
    11. Gans, H. J. (2010). Concentrated poverty: A critical analysis. Challenge, 53(3), 82-96. https://community-wealth.org/sites/clone.community-wealth.org/files/downloads/article-gans_1.pdf
    12. Duncan, G., & Magnuson, K. (2011). The long reach of early childhood poverty. In Stanford Center on Poverty and Inequality (Ed.), The Effects of Deprivation: Does Poverty Get Under the Skin? Pathways Magazine, Winter 2011, 22-27
    13. Richardson, C. (2019). Why is economic mobility so surprisingly low in North Carolina. Center for the Study of Free Enterprise Issue Briefs, 1(1), https://affiliate.wcu.edu/csfe/wp-content/uploads/sites/61/2019/02/CSFE-Issue-Briefs-Richardson-Economic-Mobility.pdf
    14. Pager, D. (2003). The mark of a criminal record. American Journal of Sociology, 108(5), 937-975.
    15. Pager, D., & Shepherd, H. (2008). The sociology of discrimination: Racial discrimination in employment, housing, credit, and consumer markets. Annu. Rev. Sociol, 34, 181-209.
    16. Shores, K., Kim, H. E., & Still, M. (2020). Categorical inequality in black and white: Linking disproportionality across multiple educational outcomes. American Educational Research Journal, 1-43
    17. National Research Council. (1995). Measuring poverty: A new approach. National Academies Press.
    18. Forsyth Futures. (2019). The Benefits Cliff in Forsyth County, 2019. https://sites.google.com/forsythfutures.org/benefits-cliff-forsyth-2019
    19. Tikkanen, R. & Abrams, M. K. (2020, January 30). U.S. health care from a global perspective, 2019: Higher spending, worse outcomes? The Commonwealth Fund. https://www.commonwealthfund.org/publications/issue-briefs/2020/jan/us-health-care-global-perspective-2019.
    20. American Hospital Association. (2019, October). The importance of health coverage. https://www.aha.org/system/files/media/file/2019/10/report-importance-of-health-coverage_1.pdf.
    21. Pencer, J. C., Gertner, A. K., & Silberman, P. (2019). Health status and access to care for the North Carolina Medicaid gap population. North Carolina Medical Journal, 80(5), 269-275.
    22. Garfield, R., Orgera, K., & Damico, A. (2020, January). The coverage gap: Uninsured poor adults in states that do not expand medicaid. Issue Brief, Kaiser Family Foundation. http://files.kff.org/attachment/Issue-Brief-The-Coverage-Gap-Uninsured-Poor-Adults-in-States-that-Do-Not-Expand-Medicaid
    23. Escarce, J. J., & Kapur, K. (2006). Access to and quality of health care. Hispanics and the Future of America, 410-446. https://www.ncbi.nlm.nih.gov/books/NBK19910/?report=printable
    24. Medicaid.Gov (2019, December 11). Medicaid and CHIP coverage of lawfully residing children & pregnant women. Retrieved September 11, 2020, from https://www.medicaid.gov/medicaid/enrollment-strategies/medicaid-and-chip-coverage-lawfully-residing-children-pregnant-women.
    25. Sawhill, I. (2001, October 1). What Can be Done to Reduce Teen Pregnancy and Out-of-Wedlock Births? Brookings. https://www.brookings.edu/research/what-can-be-done-to-reduce-teen-pregnancy-and-out-of-wedlock-births/
    26. Centers for Disease Control and Prevention. (2019, March 1). Reproductive health: Teen Pregnancy. https://www.cdc.gov/teenpregnancy/about/index.htm